- NetWitness Community
- Discussions
- Re: LUA Parser to detect and alert if CheckPoint logs are falling behind
-
Options
- Subscribe to RSS Feed
- Mark Topic as New
- Mark Topic as Read
- Float this Topic for Current User
- Bookmark
- Subscribe
- Mute
- Printer Friendly Page
LUA Parser to detect and alert if CheckPoint logs are falling behind
- Mark as New
- Bookmark
- Subscribe
- Mute
- Subscribe to RSS Feed
- Permalink
- Report Inappropriate Content
2016-05-17 05:44 AM
I have written a LUA parser that will detect if you are falling behind with your Check Point log collection.
Prerequisites are:
Change the header number 02 in the Check Point parser. (I have attached the modified checkpoint parser to this case)
<HEADER
id1="0002"
id2="0002"
devts="MDYTS(hmonth,hday,hyear,htime)"
content="<hmonth> <hday> <hyear> <htime> %CHKPNT-<hlevel>-<messageid>: <!payload>" />
I basically change month, day,year and time in this header to hmonth, hday,hyear and htime.
The reason for this is that I need them in text.
Add the following to you table-map-custom.xml file
<!- BEGIN Check Point Date Time Header Fields -->
<mapping envisionName="hyear" nwName="hyear" flags="None" format="Text"/>
<mapping envisionName="hmonth" nwName="hmonth" flags="None" format="Text"/>
<mapping envisionName="hday" nwName="hday" flags="None" format="Text"/>
<mapping envisionName="htime" nwName="htime" flags="None" format="Text"/>
<mapping envisionName="fld49" nwName="fld49" flags="None" format="Text" />
<!- END Check Point Date Time Header Fields -->
Add the following to your index-concentrator-custom.xml files
<key description="Seconds Delay" level="IndexValues" name="seconds.delay" format="UInt32" defaultAction="Open" valueMax="10000" />
<key description="Event Time String" level="IndexValues" name="event.time.str" format="Text" valueMax="2500000"/>
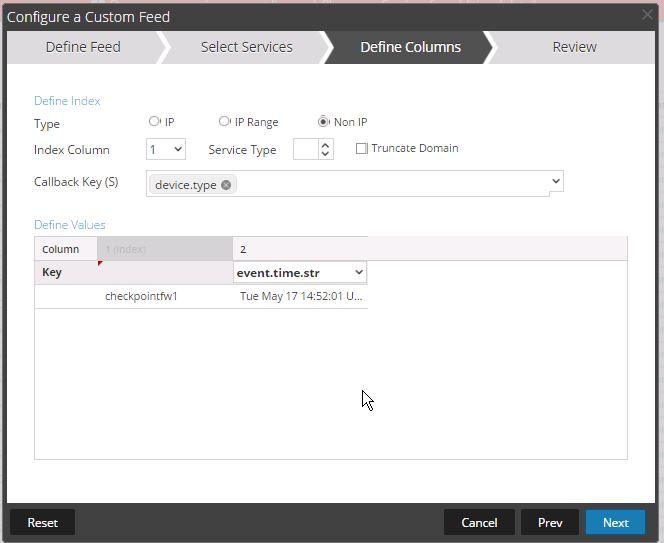
Set up your timestamp feed as detailed in the post below.
A typical checkpoint message might look something like this
May 17 2016 08:59:47: %CHKPNT-6-060020: accept,192.168.202.243,inbound,eth1,192.168.200.200,45314,54.152.120.25,443,https,tcp,8,7373,0:00:01, , , , , , , , , , , , , , ,6039,1334, , , , , ,17May2016 8:59:47,1,VPN-1 & FireWall-1, , , , , , , , , , ,17May2016 8:59:26,17May2016 8:59:27,20,9,11,11,9,1334,6039,eth1,eth0,eth0,eth1,0,0,0, , , , , ,060020, , , , , , , , , , , , , , , ,{F73441C3-A91E-4603-914C-890BBBCFB32A}, , , , ,
We compare the difference between the time in the message and the time in the header field. These are highlighted in red.
If the difference is greater than 5 seconds we create an alert "WARNING Checkpoint: Processing Delayed"
If the difference is greater than 10 seconds we create an alert "CRITICAL Checkpoint: Processing Delayed"
These are configurable in the lua parser and are probably too sensitive for a production environement.
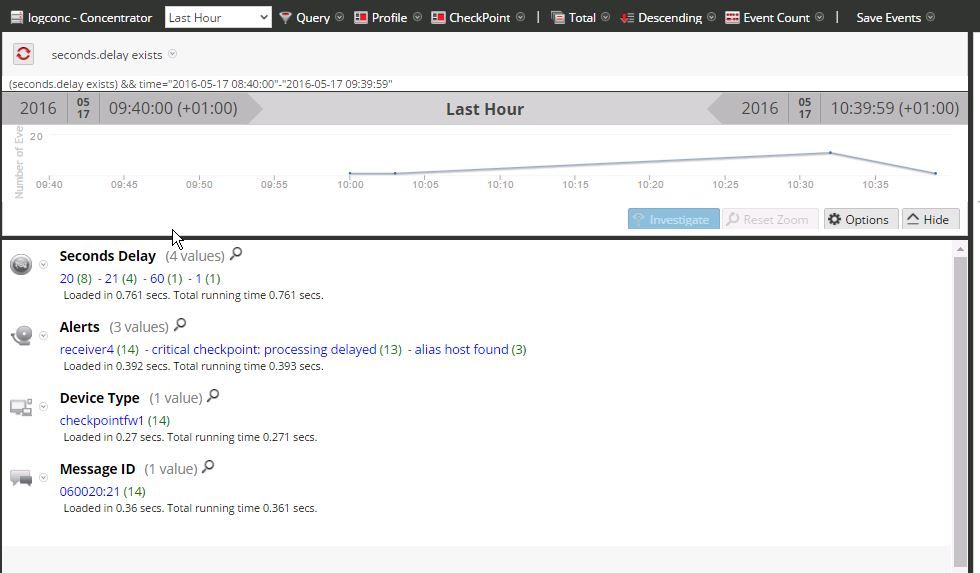
The amount of delay is written into the new meta key "seconds.delay"
The parser should be placed in /etc/netwitness/ng/parsers on your logdecoder.
Notes:
- I only look at certain checkpoint message ID's.
- Comment the nw.logInfo lines with -- in front of them to disable debugging.
-If your header and log times are in different timezones - you will need to add or subtract multiple of 3600 seconds to the HeaderEpochTime or EventEpochTime variables so that you are comparing times in the same timezones.
NOTE: Updated Version 2 of Parser attached below:
- Mark as New
- Bookmark
- Subscribe
- Mute
- Subscribe to RSS Feed
- Permalink
- Report Inappropriate Content
2016-05-17 10:51 AM
One issue with this is that it compares the Header Date with the log Date. This is fine to detect the if there is a delay with collecting the logs, but it wont detect if the delay is with us processing the logs at the log decoder.
Unfortunately, I would really like to use the event.time meta in my LUA parser. This is however a 64 bit integer and not supported by the 32 bit version of LUA that is currently on the Security Analytics decoders.
To get around this, on the Security Analytics SA Server, I create a timestamp feed.
A cron job that runs every minute has the following:
vi /etc/cron.minute/timestamp.sh
#!/bin/bash
# Script to write a timestamp in a feed file
for i in {1..60}
do
echo checkpointfw1,$(date -u) >/var/netwitness/srv/www/feeds/timestamp.csv
sleep 1
done
I then use the output csv file as a feed that updates every minute.
In my CheckPoint events I will now have new meta called event.time.str that will be the (rough) timestamp of when the event reached the Log Decoder. Potentially this timestamp might be out by a minute or more, but is probably good enough for our situation.
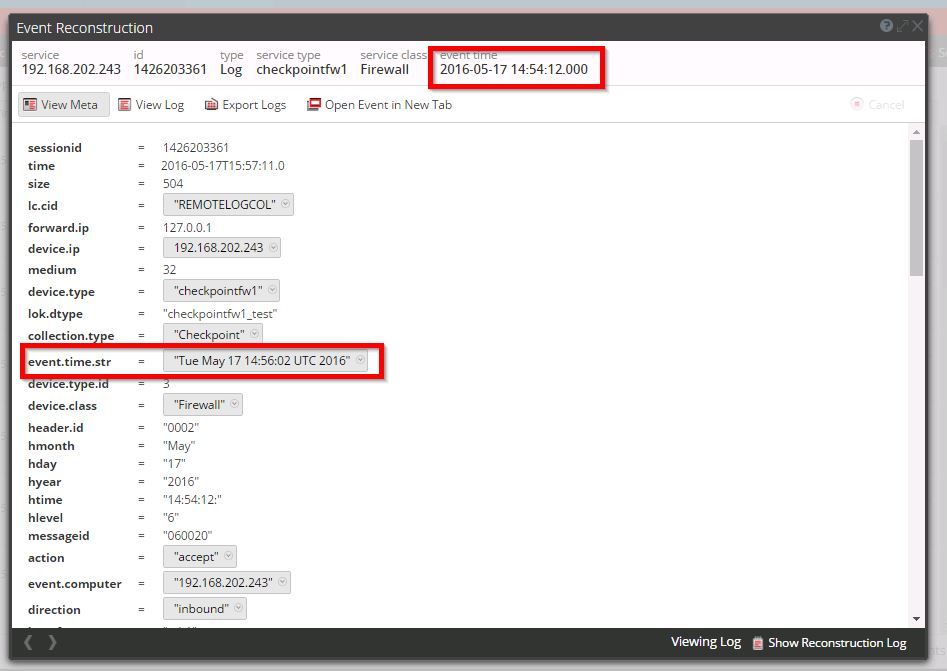
In the screenshot above
event.time is 2016-05-17 14:54:12.000
event.time.str is Tue May 17 14:56:02 UTC 2016
which is good enough for our purposes.
- Mark as New
- Bookmark
- Subscribe
- Mute
- Subscribe to RSS Feed
- Permalink
- Report Inappropriate Content
2016-05-24 06:05 AM
Just a note, that in the case we were troubleshooting, the cause of the delayed logs was found to be that the customer was using Accounting Logs in checkpoint. For these logs a start time and an end time are recorded for the TCP Session in the log.
We create the header log message from the information in the message, so the time in the header of the message is not necessarily the time that the Check Point message was written to the log collector. In the example message below from my test system, the session started at 18May2016 14:37:46 and then continued until 18May2016 20:37:52. The log was received at the logdecoder after 20:37:52 and so this looked as if there was a 6 hour difference in processing the log.
In the example:
May 18 2016 14:37:46: %CHKPNT-6-060020: accept,192.168.202.243,inbound,eth0,192.168.202.1,59515,192.168.123.4,22,ssh,tcp,10,716869,6:01:22, , , , , , , , , , , , , , ,670625,46244, , , , , ,18May2016 14:37:46,1,VPN-1 & FireWall-1, , , , , , , ,ssh, , ,18May2016 14:37:46,18May2016 20:37:52,1318,606,712,712,606,46244,670625,eth0,eth0,eth1,eth1,2,0,0, , , , , ,060020, , , , , , , , , , , , , , , ,{FDF89252-FD12-41EE-8BF5-29B83235182E}, , , , ,
The header time is generated from the 18May2016 14:37:46 part of the log message. It does not mean that the log message was received at May 18 2016 14:37:46
- Mark as New
- Bookmark
- Subscribe
- Mute
- Subscribe to RSS Feed
- Permalink
- Report Inappropriate Content
2016-06-27 11:10 AM
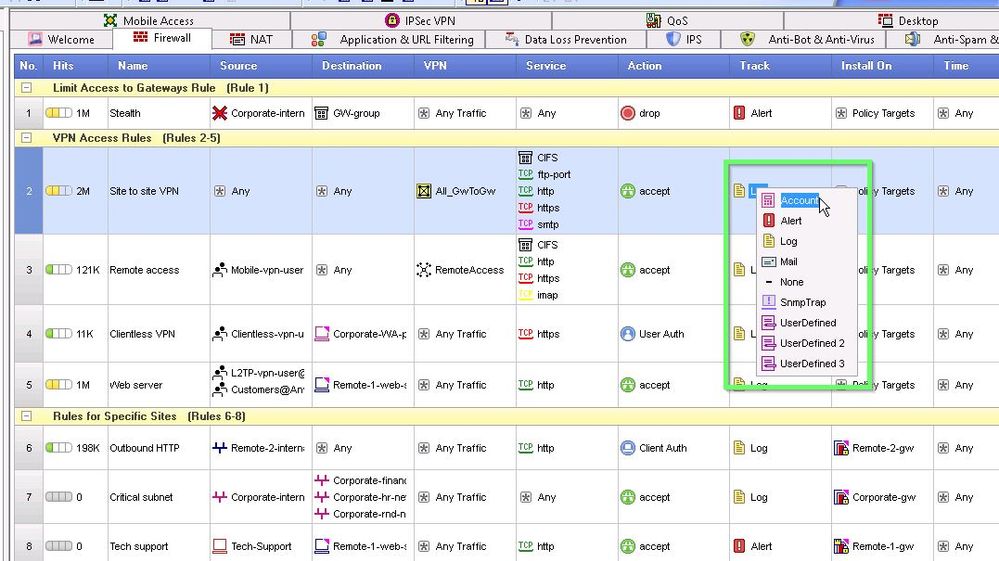
Under the Track Column in Check Point Smart Dashboard "Account" rather than "log" will be listed.
- Mark as New
- Bookmark
- Subscribe
- Mute
- Subscribe to RSS Feed
- Permalink
- Report Inappropriate Content
2016-07-18 11:54 AM
hey david,
Any chance you could have the content engineering support this parser? There are hurdles that we have jump through to merge content whenever we have a custom parser in production and RSA releases a newer parser that we have requested.
- Mark as New
- Bookmark
- Subscribe
- Mute
- Subscribe to RSS Feed
- Permalink
- Report Inappropriate Content
2017-04-19 07:34 AM
There have been a few changes to the checkpoint parser, which means the original parser posted here also needs to be updated.
Bascially the time in the log is now in fld85.
After updating your CheckPoint parser from Live please ensure:
1. Change the header number 02 in the Check Point parser.
<HEADER
id1="0002"
id2="0002"
devts="MDYTS(hmonth,hday,hyear,htime)"
content="<hmonth> <hday> <hyear> <htime> %CHKPNT-<hlevel>-<messageid>: <!payload>" />
2. Update your table-map-custom.xml file
<!- BEGIN Check Point Date Time Header Fields -->
<mapping envisionName="hyear" nwName="hyear" flags="None" format="Text"/>
<mapping envisionName="hmonth" nwName="hmonth" flags="None" format="Text"/>
<mapping envisionName="hday" nwName="hday" flags="None" format="Text"/>
<mapping envisionName="htime" nwName="htime" flags="None" format="Text"/>
<mapping envisionName="fld49" nwName="fld49" flags="None" format="Text" />
<mapping envisionName="fld85" nwName="fld85" flags="None" format="Text" />
<!- END Check Point Date Time Header Fields -->
The last one is new as the parser got updated.
3.Modify the line in the lua parser from:
[nwlanguagekey.create("fld49", nwtypes.Text)] = lua_CheckPointTime.getEventTime,
to
[nwlanguagekey.create("fld85", nwtypes.Text)] = lua_CheckPointTime.getEventTime,


