- NetWitness Community
- Discussions
- Re: Can I find out what is using up my storage?
-
Options
- Subscribe to RSS Feed
- Mark Topic as New
- Mark Topic as Read
- Float this Topic for Current User
- Bookmark
- Subscribe
- Mute
- Printer Friendly Page
Can I find out what is using up my storage?
- Mark as New
- Bookmark
- Subscribe
- Mute
- Subscribe to RSS Feed
- Permalink
- Report Inappropriate Content
2017-08-17 05:57 AM
Hello
Is there anyway of finding out what packets and logs are using up my storage space in Netwitness?
I am currently truncating SSH and SSL traffic payloads to reduce storage space, but does anyone have any suggestions on how to check which logs and packets are taking up most of my storage space?
In investigation view what does the "Event Size" option actually show?
Thanks for the help.
- Mark as New
- Bookmark
- Subscribe
- Mute
- Subscribe to RSS Feed
- Permalink
- Report Inappropriate Content
2017-08-17 06:15 AM
Hi David,
Event Size Quantifies the size in bytes for both packet and log data.
Reference: https://community.rsa.com/docs/DOC-78594
- Mark as New
- Bookmark
- Subscribe
- Mute
- Subscribe to RSS Feed
- Permalink
- Report Inappropriate Content
2017-08-17 06:50 AM
Hi I think the event count shows the size of the events before the payload is truncated.
How can I find out what is actually responsible for using my disk storage so that I can potentially filter or truncate packets /logs in application rules to increase my retention?
- Mark as New
- Bookmark
- Subscribe
- Mute
- Subscribe to RSS Feed
- Permalink
- Report Inappropriate Content
2017-08-17 07:05 AM
Hi David,
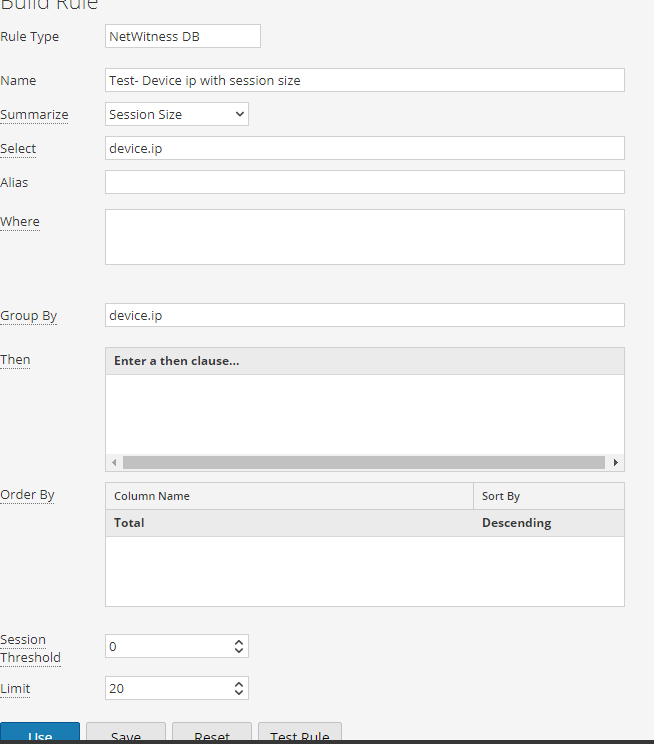
Please try the below rule to have top 20 Devices sending high session size.
- Mark as New
- Bookmark
- Subscribe
- Mute
- Subscribe to RSS Feed
- Permalink
- Report Inappropriate Content
2017-08-21 04:53 AM
Thanks Sravan. This shows the size of the packet or log at capture time. I have application rules that truncate the traffic so that the payload is not kept. This does not affect the capture size.
What I am after is a way of finding out what is using up my storage space on my DAC's.
- Mark as New
- Bookmark
- Subscribe
- Mute
- Subscribe to RSS Feed
- Permalink
- Report Inappropriate Content
2017-08-21 05:37 AM
Hey David,
If the truncated payload is not visible in investigation then I believe that the Event size should be accurate (without the payload).
Easiest way to test this is to duplicate 1 event (or find one of similar size) of same length as the truncated candidate but making sure that it will bypass the app-rule and arrive intact. Then compare the size of that with the size of the truncated one to determine what exactly is Event Size meant to display.
Interested to know the result if you get to test this.
Cheers
Marinos
- Mark as New
- Bookmark
- Subscribe
- Mute
- Subscribe to RSS Feed
- Permalink
- Report Inappropriate Content
2017-08-29 05:50 PM
Hello David:
The event size is one way to approach it, but as mentioned this is really the size of event when parsed which may not incorporate the entire network session payload and does not entirely equate to size on disk. This will get you ball park numbers around what service or device type makes up the most of your bandwidth which can loosely equate to what is using up the majority of your storage at least for some time period.
Some stats do exist in Security Analytics 10.6.3 that might help you here.
capture.netfilter.bytes = total size of packets filtered out due to matching network rules
capture.appfilter.bytes = total size of bytes removed from packet stream due to application rule actions filter or truncate (counts only payload bytes dropped)
capture.processed.bytes = total size of bytes processed minus netfilter or appfilter bytes.
These are available in the decoder stats section in Decoder > Admin > Explore view.
This will give you an idea of how well your truncation and filtering is saving disk space. To determine exactly what logs or network events are using the most disk space would have to extend this into more retention planning stats. What granularity are you looking for? Would showing disk usage by service and device.type be sufficient? Is the goal to then be able to take action by filtering or truncating or changing selective retention policy?
- Mark as New
- Bookmark
- Subscribe
- Mute
- Subscribe to RSS Feed
- Permalink
- Report Inappropriate Content
2017-08-30 04:58 AM
Hi Bill thanks for the reply and useful pointers.
In response to your question:
What granularity are you looking for? Would showing disk usage by service and device.type be sufficient? Is the goal to then be able to take action by filtering or truncating or changing selective retention policy?
Disk Usage by service and device.type would be a start. Maybe even source ip, dst ip and device.ip I'm just after a way to see what it using up my physical storage so that I can then make decisions on filtering and truncating.


