- NetWitness Community
- Discussions
- Memory Metrics for ESA Rules in 11.x
-
Options
- Subscribe to RSS Feed
- Mark Topic as New
- Mark Topic as Read
- Float this Topic for Current User
- Bookmark
- Subscribe
- Mute
- Printer Friendly Page
- Mark as New
- Bookmark
- Subscribe
- Mute
- Subscribe to RSS Feed
- Permalink
- Report Inappropriate Content
2020-02-14 01:15 PM
Hi all,
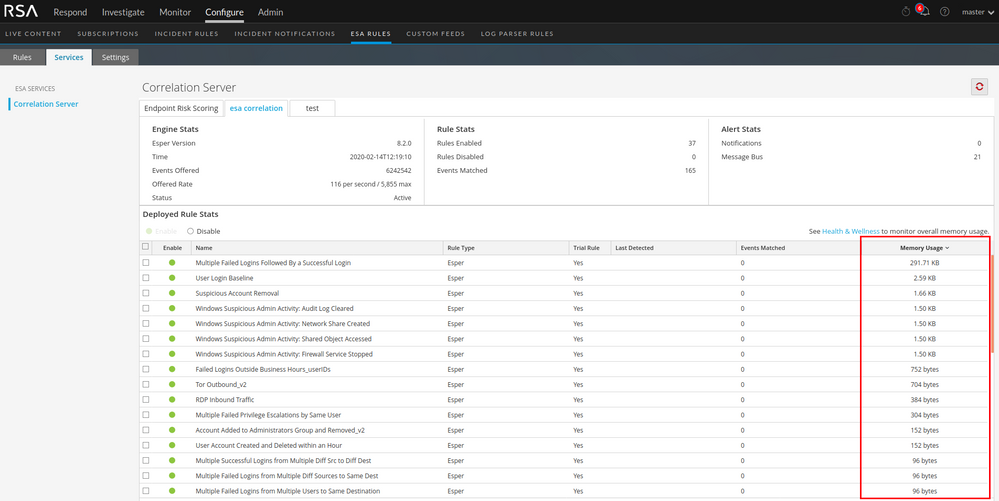
I want to find out which ESA rules are causing high memory usage problems.
I found this documentation: Alerting: View Memory Metrics for Rules, but it was made for Security Analytics 10.6.5.
I cannot seem to find a way to do this in Netwitness 11.x (particularly 11.3).
Anyone know about this?
Thank you and have a nice day.
Accepted Solutions
- Mark as New
- Bookmark
- Subscribe
- Mute
- Subscribe to RSS Feed
- Permalink
- Report Inappropriate Content
2020-02-14 03:36 PM
In 11.3+ you can view each active rule's memory utilization in the UI at Configure/ESA Rules under the Services tab:
Mr. Mongo
- Mark as New
- Bookmark
- Subscribe
- Mute
- Subscribe to RSS Feed
- Permalink
- Report Inappropriate Content
2020-02-14 03:36 PM
In 11.3+ you can view each active rule's memory utilization in the UI at Configure/ESA Rules under the Services tab:
Mr. Mongo
- Mark as New
- Bookmark
- Subscribe
- Mute
- Subscribe to RSS Feed
- Permalink
- Report Inappropriate Content
2020-02-20 12:02 PM
Thank you Josh for the information.
Are these statistic for the last hour as they were in 10.6?


