- NetWitness Community
- Discussions
- Re: High memory utilization in ESA
-
Options
- Subscribe to RSS Feed
- Mark Topic as New
- Mark Topic as Read
- Float this Topic for Current User
- Bookmark
- Subscribe
- Mute
- Printer Friendly Page
High memory utilization in ESA
- Mark as New
- Bookmark
- Subscribe
- Mute
- Subscribe to RSS Feed
- Permalink
- Report Inappropriate Content
2016-04-09 03:47 AM
In Security Analytics 10.5.1, we are facing high memory utilization in ESA. Even if I disable all the deployed rules, the free memory available in ESA is around 40% of overall memory.
Not sure where the memory is being utilized.
Before disabling the rules:
free -g -->
total used free shared buffers cached
Mem: 94 94 0 0 0 12
-/+ buffers/cache: 81 13
Swap: 7 4 3
After disabling all the rules:
free -g -->
total used free shared buffers cached
Mem: 94 55 39 0 0 17
-/+ buffers/cache: 38 56
Swap: 7 0 7
- Mark as New
- Bookmark
- Subscribe
- Mute
- Subscribe to RSS Feed
- Permalink
- Report Inappropriate Content
2016-04-11 03:55 AM
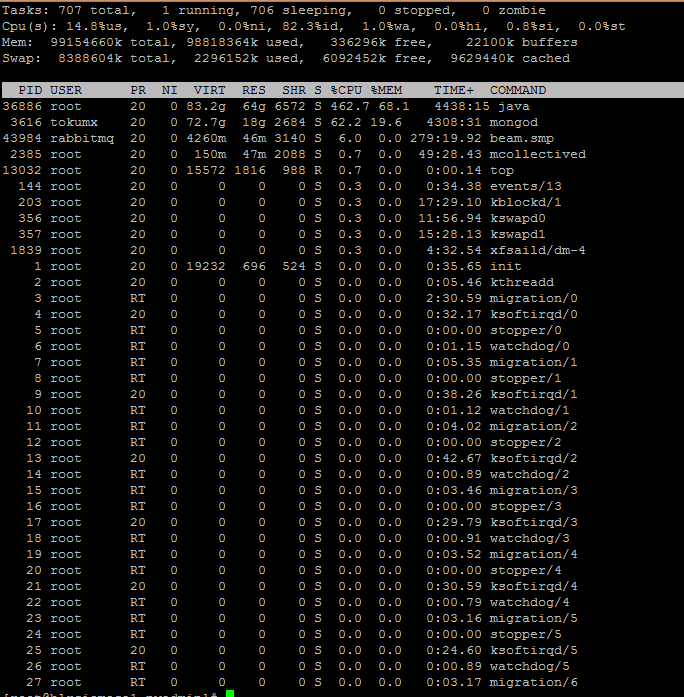
Can you check the processes using your memory by using top command and then confirm
- Mark as New
- Bookmark
- Subscribe
- Mute
- Subscribe to RSS Feed
- Permalink
- Report Inappropriate Content
2016-04-11 05:02 AM
Hi Mohd Saad
PFB the snap-shot:
- Mark as New
- Bookmark
- Subscribe
- Mute
- Subscribe to RSS Feed
- Permalink
- Report Inappropriate Content
2016-04-11 08:40 AM
Hi Shrinidhi,
With Linux, it will borrow unused memory for disk caching. This makes it appear as if the OS is consuming large amounts of memory unnecessarily when in actual fact it is not. This doesn't mean that it is not available for when an application requires it, the memory will be released as and when required.
To get a better understanding of how much RAM is available, when reading the output of the "free -g" command you want to be looking at the "-/+ buffers/cache" line.
It would also be useful to understand how many Concentrators the ESA consumes from as well ingestion rates for each. This could explain the high memory utilisation when the rules are enabled.
Cheers,
Lee
- Mark as New
- Bookmark
- Subscribe
- Mute
- Subscribe to RSS Feed
- Permalink
- Report Inappropriate Content
2016-08-18 12:57 AM
Hi Lee,
in 10.6, getting this same Alarms for High Memory Utilization. What should we do, if it reach around 97% of total memory.
Note that, utilization carried out for more then 12 hours.
Please suggest.
- Mark as New
- Bookmark
- Subscribe
- Mute
- Subscribe to RSS Feed
- Permalink
- Report Inappropriate Content
2016-08-30 04:42 AM
Hi,
When getting such alarms on ESA indicates high utilization of memory by ESA rules (which includes large number of rules deployed on ESA or large number of events captured by ESA rules) due to which message bus gets loaded up
In order to get rid of such issues either deploy less number of ESA rule or take a regular backup of tokumx database on ESA and clear alerts from database.
- Mark as New
- Bookmark
- Subscribe
- Mute
- Subscribe to RSS Feed
- Permalink
- Report Inappropriate Content
2016-08-30 05:31 AM
Hi Soumyajit,
I would suggest looking into the Health and Wellness view for your ESA appliance. You will be able to see memory utilisation for each rule you have deployed - this could give an indicator into which rules require tuning.
More details surrounding this can be found here:
Cheers,
Lee
- Mark as New
- Bookmark
- Subscribe
- Mute
- Subscribe to RSS Feed
- Permalink
- Report Inappropriate Content
2016-08-30 11:28 AM
Hi Dhara,
Monitor all the ESA rules in Health and wellness for memory utilisation. Select the rules that are using high memory and fine tune them for better performance. Disable all the unnecessary rules and when creating or editing any rule then use trial option for monitoring memory utilisation.
Thanks..
- Mark as New
- Bookmark
- Subscribe
- Mute
- Subscribe to RSS Feed
- Permalink
- Report Inappropriate Content
2016-08-31 11:47 AM
You can also run the watch free command and watch how Linux/Centos in SA's case utilizes the memory as the requirements change. It is a good visual verification.


