Drill into Metadata in the Events View
When working in the Events view, the focus of an investigation is the smallest possible set of relevant events in sequential order. You can reduce the number of visible events loaded in the Events view using query profiles, column groups, meta groups, and queries. However, it is more efficient to limit the data set using the metadata indexed on the Concentrator before looking at the actual events stored on the Decoder or Log Decoder.
It is best to start by looking at the meta keys and meta values indexed on the Concentrator and drill into the metadata in the Navigate view to find a relevant set of events, with each drill or query further limiting the data set. When you have a meaningful data set, or drill point, you can examine the details of the related events in sequential order in the Events view.
You can drill into the metadata in the Events Meta panel, without leaving the Events view. The list of meta keys and meta values shown is related to all events seen in the environment for the time range in the query. When you find the drill point of interest in the Filter Events panel, you can open the Events panel to see the sequential events. The set of events loaded in the Events view is smaller and loads faster. The flow of an investigation is smoother with less hopping between views. The following figure illustrates the panel, open to the left of the Events panel.
Note: There are two situations in which results in the Filter Events panel may not be as expected:
-In a mixed-mode environment with a Version 11.5 Broker and some Core services at NetWitness Platform Version 11.4 or earlier, a text filter is not supported in the Filter Events panel. If the query in the Events panel includes a text filter, the result set in the Events panel and Filter Events panel may be different.
-If the query in the Events view query builder has a logical OR or &&, the results in the Events view may be different from results for the same query in the Navigate view and Legacy Events view. In this situation, a set of parentheses automatically encloses the logical OR expression in the Navigate view and Legacy Events view, while parentheses have to be manually added in the Events view. If this occurs, you need to enclose the logical OR expression in an additional set of parentheses; select the two filters in the query bar, right-click one of them, and select Wrap in parentheses in the menu.
Note: (Version 11.5.1) In the Filter Events panel, the meta values result threshold is 100000. If results are above the threshold, it is indicated using either ~ or >. For example, (>100000) indicates that the results are sorted based on count and are greater than the threshold. Similarly, (~100000) indicates that the results are sorted based on size and are greater than the threshold.
Modes of Operation
The Filter Events panel has two modes of operation.
- The narrow Events Meta panel is part of a faceted search view into the data (shown above). Left- or right-clicking a meta value adds a new filter, automatically executes a new query, and displays matching events in the sequential list of events. When both panels are open, you can drill into the data in both the Events Meta panel and the Events panel . Each time you left-click a meta value in the Filter Events panel, an expression is appended to the query bar, and the query is executed by default. The query results show new metadata to filter by in the Events Meta panel and the resulting events that match the query in the Events panel. If you change the service or other query elements in the Events panel, you need to execute the query to reload the Filter Events panel.
- The fully expanded Filter Events panel uses the full width of the browser window to provide ample real estate to hunt through the metadata without the performance load of immediately submitting a query or viewing the sequential events. As you click a new meta value and drill into the meta values, each meta value is added to the query filter and executed in the Filter Events panel, so that the number of events seen is reduced. Because the Events panel is closed, the query in the Events panel is not updated and the query is not executed. When you collapse the Filter Events panel back to original size, the Events list opens and the query is executed. This is an example of the fully expanded panel.
View Metadata in the Events Meta Panel
To view metadata in the Events Meta panel
- Go to Investigate > Events, select a service to investigate, and select a time range.
- (Optional) Select a column group or a query profile.
- Click
to load events in the Events panel.
A query is executed in the Events panel and matching events are listed, - Click the Filter button (
) in the Events panel.
The Events panel opens to the left of the Events panel.
Note: By default, the Filter Events panel is open in the Events view. The last used state of the panel (narrow or fully expanded) is saved throughout the session and across logins. Also, the Filter Events panel provides additional contrast between meta keys, meta values, and meta counts to improve readability.
The Default Meta Keys meta group is in effect the first time you log in. If you selected a different meta group the last time you logged in, it remains in effect until browser cache is cleared. The meta group you selected previously is not stored in browser cache so it remains in effect until you change it. See Use Meta Groups to Focus on Relevant Meta Keys for details about meta groups. Based on the contents of the index file for the service, the Filter Events panel is populated with the first 25 meta keys that have at least one meta value and are open. When using the Default Meta Keys group in the Filter Events panel, only the first 30 meta keys with values are open and the remaining are closed. Closed meta keys may be listed, but they do not count toward the 25 or 30 meta keys total. Meta keys with no values are listed at the bottom of the panel. You can expand, collapse, and close the panel using the standard panel controls (


Do one of the following:
- To close the dialog without editing, click Close.
- To close the dialog and select the copy of the meta group, click Select Meta Group.
The group is added to the Meta Group menu. The figure below has a private copy of the RSA HTTP meta group.
Show Max Value of Meta Groups
In case all the values have not rendered and displayed, you can click Show Max Value to view all the values at once.
-
With the Filter Events panel open in the 11.6 Events view, click
and select the Show Max Values option.
- The values that were not rendered earlier will begin to load and a maximum of 1000 results are displayed.
View the Context Lookup Panel in the Events Meta Panel
In the Events Meta panel, you can click a meta entity to open the context tooltip. The context tooltip is available only for the meta keys that are defined as an entity the Context Hub supports. The Context Hub service is pre-configured with default meta types and meta keys mapping. For information about mapping of the context hub meta values with investigation meta keys, see "Configure Meta Type Mapping for Context Hub" in the Context Hub Configuration Guide. The context tooltip includes the following two sections.
Context Highlights - The information in this section helps you to determine the actions that you would like to take. It can show related data for Incidents, Alerts, Lists, Endpoint, Criticality, Asset Risk, and Threat Intelligence (TI). Depending on your data, you may be able to click these items for more information.
You can also view other options like External Lookup, Copy Value, Copy Statement, Live Lookup, Context Lookup, Pivot to Investigate > Hosts/Files, Pivot to Endpoint Thick Client, Pivot to Archer, and Add/Remove from List.
Understand Visible Metadata
Each meta key has a list of meta values, with up to 20 values displayed by default. You can click Show More Values to incrementally add 20 meta values, up to a total of 1,000 meta values, which is a hard-coded limit to optimize performance. The meta key name and plain English name of each meta key found in the service, both populated and non-populated, are listed. For each meta value, you can see the number of events in the current results that contain the value (count) or the size of the events in the current results (size). For example, the following might be listed:
Action Event [action] (3)
get(3016) login (1346) put (501)
In this example, the meta key name is action, the English name is Action Event, and three meta values were found for this meta key. There were 3016 events containing get, 1346 events containing login, and 501 events containing put. The values are ordered so that the value with the largest count is listed first.
In the following example, the same meta key has the values ordered based on the event size in bytes. The smallest size is listed first:
Action Event [action] (3)
login (13,034,588) put (21,848,760) get (1,409,079,256)
An icon before each meta key name identifies the indexing method for the key. The indexing method determines the types of interactions and queries possible using that meta key.
- This meta key is indexed by value:
. The green color indicates that the all available interactions and queries are supported. You can see the available interactions in the context menu by right-clicking the meta value.
- This meta key is indexed by meta key:
. The yellow color is a clue that a subset of available interactions is supported, and queries on this meta key may take longer than meta keys that are indexed by value. You can see the available interactions in the context menu by right-clicking the meta value.
- This meta key is not indexed:
. Values for non-indexed meta keys cannot be used to query. If you want to query a meta key that is not indexed, your administrator needs to edit the index file for the service to index the meta key by value or meta key.
- For Version 11.5.1, a set of more than 200 meta key symbols replaces the three indexing method symbols to provide a visual indicator of the purpose of the meta key. The color of the meta key symbol identifies the indexing method using the same colors as before: green, yellow, and red. A tooltip also identifies the indexing method and provides a description of the icon. The icons are defined based on categories outlined in the Unified Data Model (https://community.netwitness.com/t5/netwitness-platform-unified-data/tkb-p/netwitness-udm). There is a generic icon for most categories that do not have specific meta keys and a default meta key icon to use when a new custom meta key is added.
If an error occurs while loading a meta key, the other meta keys load as usual and an error message is displayed in the meta key that did not load. When you execute a new query, some error messages disappear. Meta keys that have no values in the set of events are listed at the bottom of the panel.
Stop and Resume Metadata Loading
You can stop and resume loading of metadata in the Version 11.5.1 Filter Events panel as the meta keys and values are loading. When loading a lot of metadata this can save time because you do not have to wait for all data to load. If you stop loading and still need to see more metadata, you can resume loading, then stop again when you see the data you want.
- While data is loading in the Filter Events panel, click the Stop button (
) in the query bar.
Meta keys stop loading, and keys that did not finish loading are closed. A message above the meta keys list informs about the status, and you can scroll down to find the last meta key to finish loading. In this example, Session Analysis finished loading; all the meta keys below remain closed. - Do one of the following:
- To resume loading at the meta key where loading stopped, click Resume.
- If you want to review the values of specific meta keys that were not loaded, without resuming the query, click the meta key name to open any key.
Close All Except One Meta Key
(Version 11.5.1 and Later) When the Filter Events panel is open, seeing many meta keys at the same time can be distracting.
To close all except one meta key
- In the meta key row of an entry, click the Meta Key options button (
).
The Meta Key options are displayed. - Select Open Only This Key.
All except the current meta key close. If the selected key is closed, it opens and data is loaded, while all other keys close.
Set the Ordering Method for Meta Values
With the Events Meta panel open, you can look at three parameters for each value: event count, event size or packet count. Each meta key entry includes either the event count, the event size or the packet count in parentheses after the value. In all cases, there are four options for ordering.
To use the ordering options
- With the Filter Events panel open, click the ordering menu label, which is named according to the selected ordering option. This is an example of the menu label when ordering by event count in ascending order by total count:
.
The Ordering menu is displayed. This figure shows the narrow version of the menu. - If you want to see the event count in parentheses after each value, select one of the following options. By default, the meta keys are displayed using the Event Count > Descending by Total Count method.
- To order by total count of events in which the value was found, select either Descending by Total Count or Ascending by Total Count.
- To order by the name of the value, select either Ascending by Value or Descending by Value.
- If you want to see the size in bytes of the events in which the value was found, select one of the following options.
- To order by total size of events in which the value was found, select either Descending by Total Size or Ascending by Total Size.
- To order by the name of the value, select either Ascending by Total Size or Descending by Total Size.
Under each meta key in the Filter Events panel, the values are ordered according to your selection.
- If you want to see number of packets (Packet Count) for meta key, select one of the following options:
- To order by the total count of packets in which the value was found, select either Descending by Total Count or Ascending by Total Count.
- To order by the name of the value, select either Ascending by Total Value or Descending by Total Value.
Note: The Packet Count filtering option is supported from NetWitness Platform 12.5 or later version.
Drill into Meta Values
With the Events Meta panel open, you can drill into meta values to focus an investigation down to the smallest possible set of relevant events. Drilling in the fully expanded Filter Events panel adds filters to the query bar and refines the displayed metadata in the Filter Events panel, but does not execute the query in the Events panel. Drilling in the narrow panel, side by side with the Events panel, adds the filter to the query bar and executes the query in the Events panel and the Filter Events panel. This figure is an example of the fully expanded panel with some metadata loaded.
You can drill into metadata in the Filter Events panel to find relevant meta values. A simple query using the (=) operator highlights the meta value used in the Filter Events panel. This helps to associate the metadata with the filter added to the query. For example, the following figure shows the meta key value, related to the query filter, highlighted in the Filter Events panel.
To drill into meta values in the fully expanded Filter Events panel
- Look for a meta value that is of interest, and click the value. Using the figure above as an example, to investigate the SMTP service type as opposed to other service types, click 25[SMTP].
The other service types are filtered out of the metadata in the Filter Events panel, but the query is not executed in the Events panel. - Look for a meta value that is of interest, and do one of the following:
- Click the value. Using the figure above as an example, to investigate the SMTP service type as opposed to other service types, click 25[SMTP].
The filter is added as the last filter in the query bar, and other service types are filtered out of the metadata in the Filter Events panel. With the Events panel closed, no query is executed there. - Right-click the value and select Add Filter - Do Not Run Query in the drop-down menu.
The filter is added as the last filter in the query bar, but no other service types are filtered out of the metadata in the Filter Events panel. With the Events panel closed, no query is executed there. - Press CTRL (Windows) or CMD (MacOS) and click the value.
The filter is added as the last filter in the query bar, but no other service types are filtered out of the metadata in the Filter Events panel. With the Events panel closed, no query is executed there.
- Click the value. Using the figure above as an example, to investigate the SMTP service type as opposed to other service types, click 25[SMTP].
- Repeat step 1 with another meta value, for example, writetoexecutable in the Action Event [action] meta key. Continue drilling into values until you find a set of events (drill point) that you want to see in sequential order.
- To view the sequential events for the drill point, click
to shrink the Filter Events panel.
The Events panel opens to the right, and the query is executed in the Events panel so that you can see the raw events in sequential order.
To drill into meta values in the narrow Filter Events panel
- Look for a meta value that is of interest, and click the value. Using the figure above as an example, to investigate the SMTP service type as opposed to other service types, click 25[SMTP].
The filter is added as the last filter in the query bar, other service types are filtered out of the metadata in the Filter Events panel, and the query is executed in the Events panel. - Look for a meta value that is of interest, and do one of the following:
- Click the value. Using the figure above as an example, to investigate the SMTP service type as opposed to other service types, click 25[SMTP].
The filter is added as the last filter in the query bar, and other service types are filtered out of the metadata in the Filter Events panel and the data set showing in the Events panel. - Right-click the value and select Add Filter - Do Not Run Query in the drop-down menu.
The filter is added as the last filter in the query bar, but no other service types are filtered out of the metadata in the Filter Events panel, and the query is not executed in the Events panel until you click the query button. - Press CTRL (Windows) or CMD (MacOS) and click the value.
The filter is added as the last filter in the query bar, but no other service types are filtered out of the metadata, and the query is not executed in the Events panel until you click the query button.
- Click the value. Using the figure above as an example, to investigate the SMTP service type as opposed to other service types, click 25[SMTP].
- Continue clicking values to refine the set of events (drill point). As you refine the set of events, examine and reconstruct the raw events for the same set in the Events panel.
Copy the Meta Values for a Meta Key
To copy all of the visible meta values for a meta key
- In the meta key row of an entry, click the Meta Key options button (
).
The Meta Key options are displayed. Currently the only option is Copy Values. - Click Copy Values.
A comma-separated list of the values is copied to your local clipboard. This is an example of the clipboard contents: "get", "login", "put".
View a Selected Meta Value in Live
- Left or right-click a meta value, for example NTP.
The Meta Value drop-down menu is displayed. - To look up the meta value, for example success, in Live, select Live Lookup.
The Live Search view is displayed with the meta value entered in the Generated Meta Values field, and ready for a search.
Append and Refocus the Investigation of a Meta Value in Unified Panel
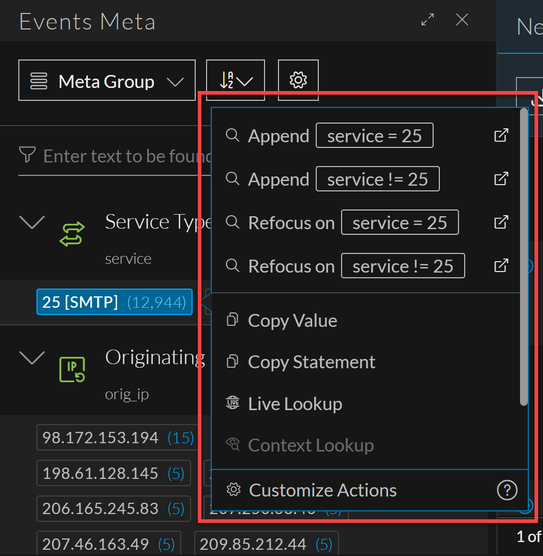
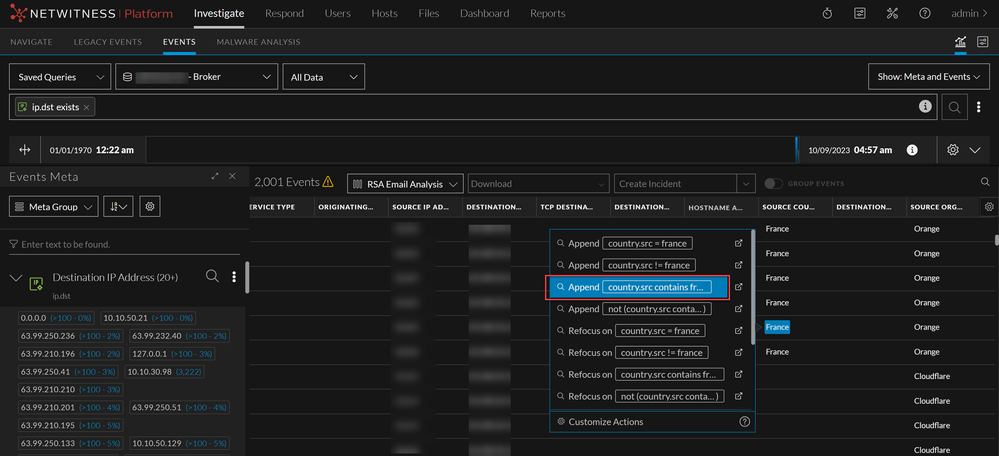
For each value listed under a meta key, the focus is <meta key> = <meta value>. When you right-click a meta value, a context menu with different Append and refocus options is displayed. All of the append and refocus actions update the drill point in the Events panel, Filter Events panel and Meta Event panel.
-
To append the key-value pair to the query with different operators (=, !=, contains ), right-click a meta value (for example SMTP in the figure below) and select one of the Apply <operator> Drill options.
-
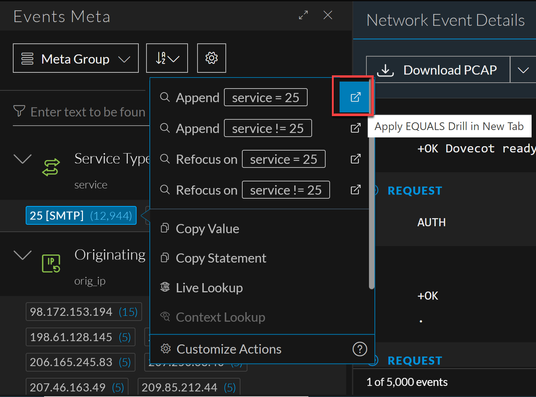
To append the key-value pair to the query or start the key-value pair over in a new browser tab, right-click a value and select one of the Append New Tab > Append <operator> Drill in New Tab or Append <operator> Drill in New Tab options.
-
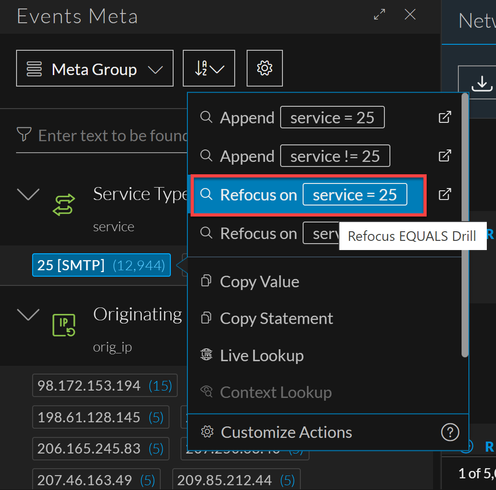
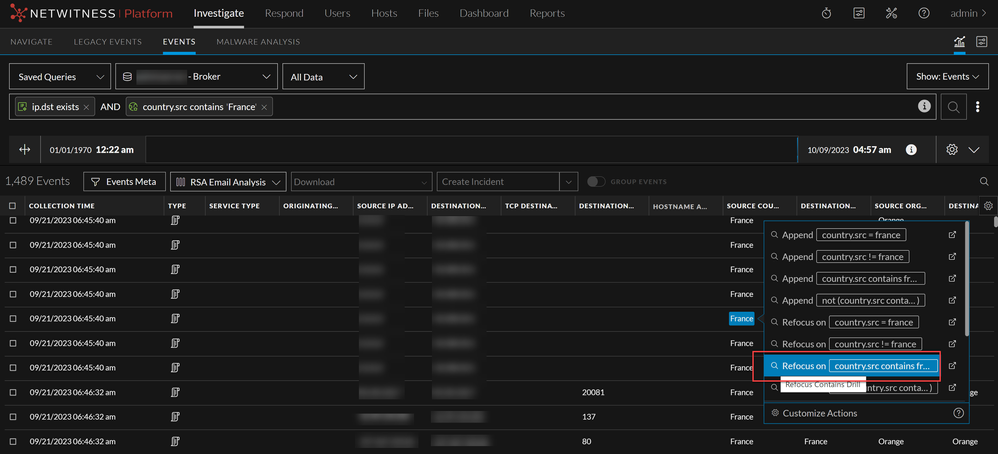
To start the query over with the key-value pair and a different operator (=, !=, contains), right-click a value and select one of the Refocus <operator> Drill options.
-
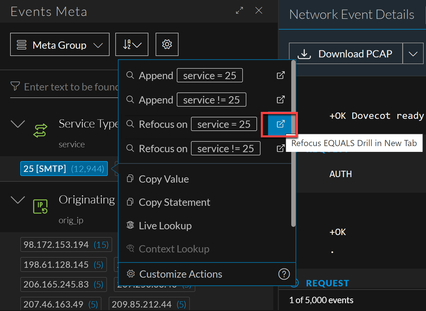
To append the key-value pair to the query or start the key-value pair over in a new browser tab, right-click a value and select one of the Refocus New Tab > Refocus <operator> Drill in New Tab or Refocus <operator> Drill in New Tab options.
The drill is refocused according to your choice, and the new query is executed in the Events panel.
-
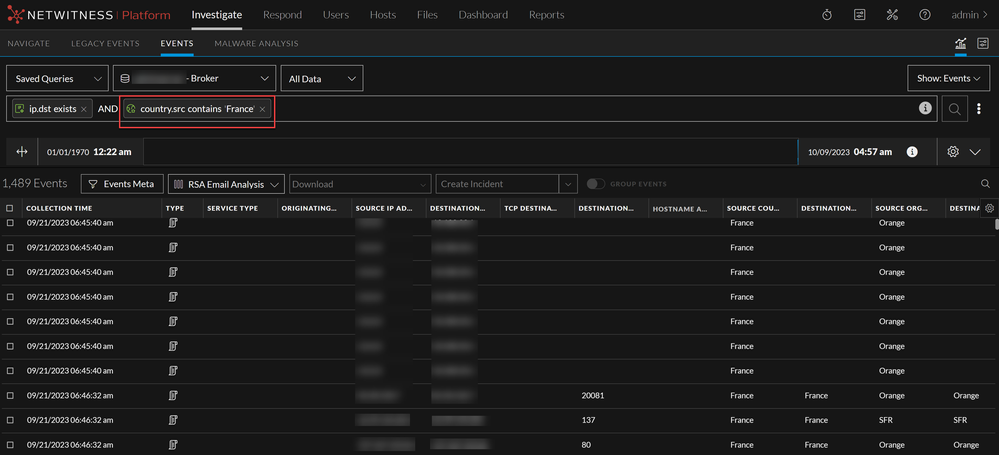
When you select a meta value using Append (Meta contains Meta value), the existing query is updated along with new query filters in the displayed search results.
-
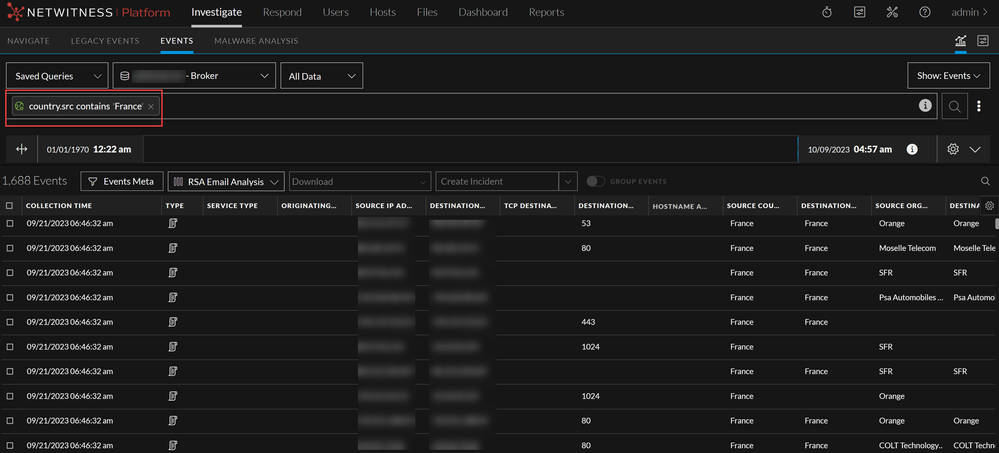
When you select a meta value using Refocus (Meta contains Meta value), the existing query is removed from the search result and the specified meta value results are displayed.
-
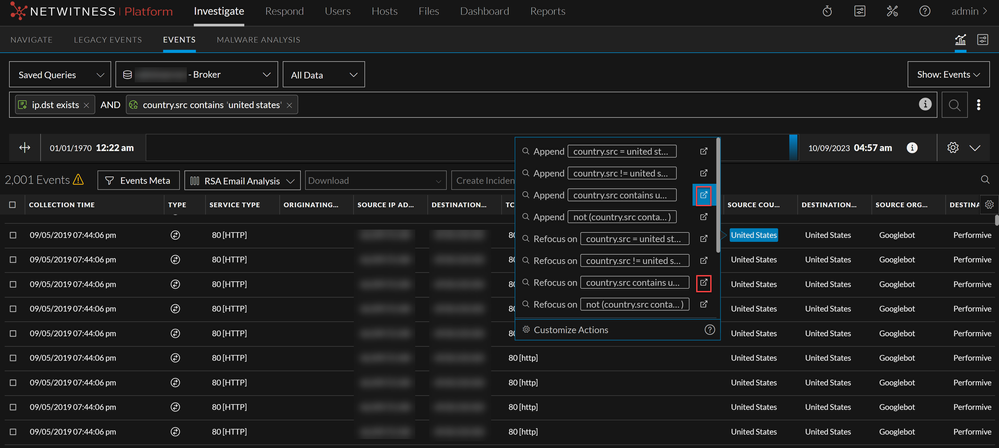
You can also Append and Refocus the meta values with Contains option using new tab option as shown below:
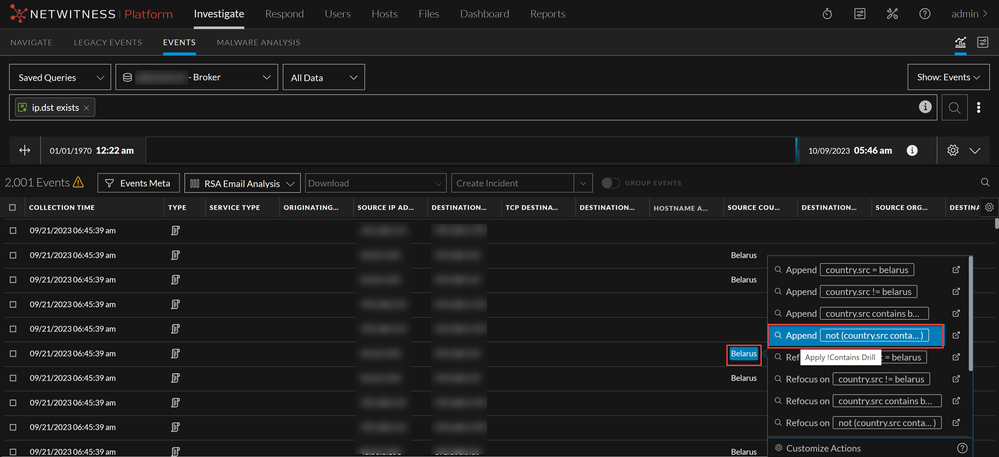
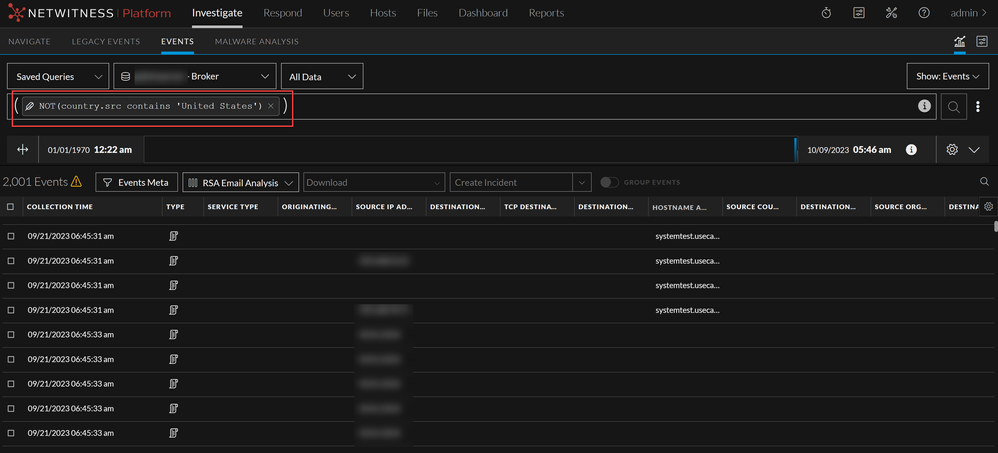
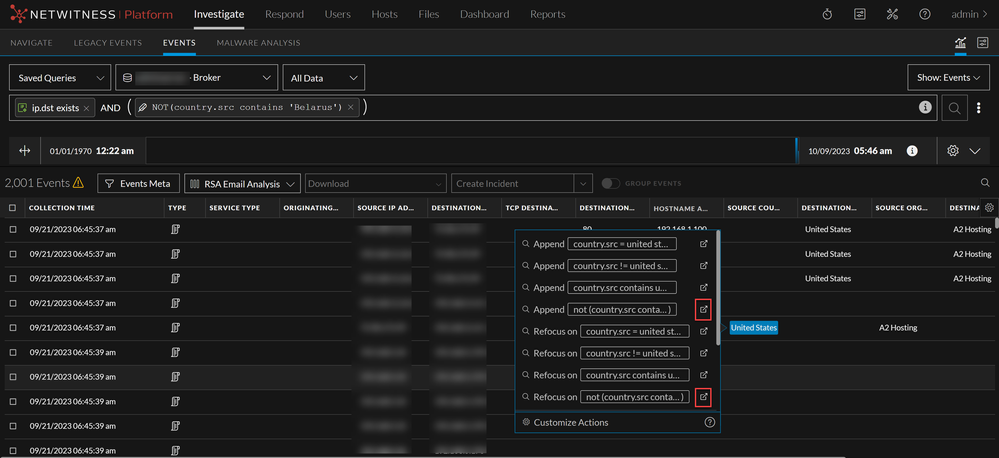
From 12.0 and later, Analysts can now exclude particular meta values while querying using the NOT(meta contains 'meta value') option available in the investigate unified panel. The specified meta value is removed from the query results when you use NOT(meta contains 'meta value') with Append or Refocus option on a specific meta value. This enhancement helps the analysts to view only the required data results in an optimized manner and conduct further investigation efficiently.
In the Events view, you can further investigate meta values in an event by left or right-clicking certain meta values and use the options in the drop-down menu.
-
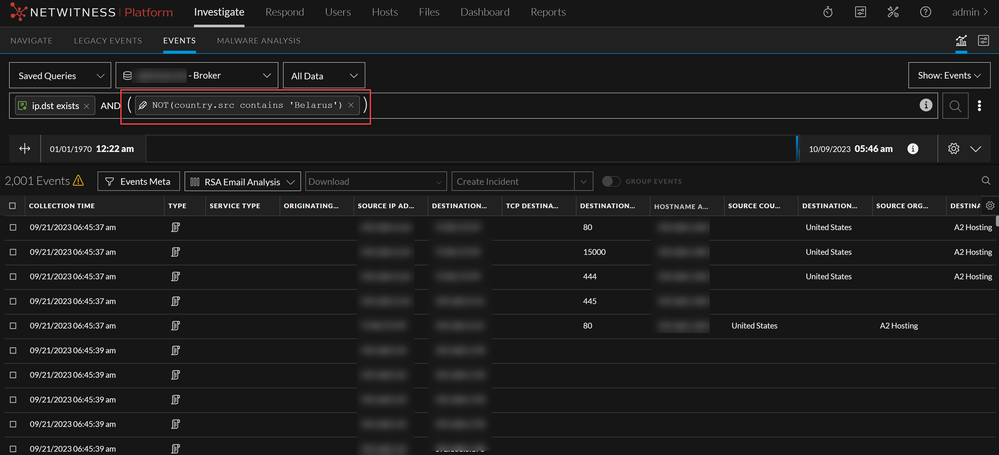
When you select a meta value using Append NOT(Meta contains Meta value), the particular query is removed, and the new query filters will be appended, resulting in NOT containing meta values.
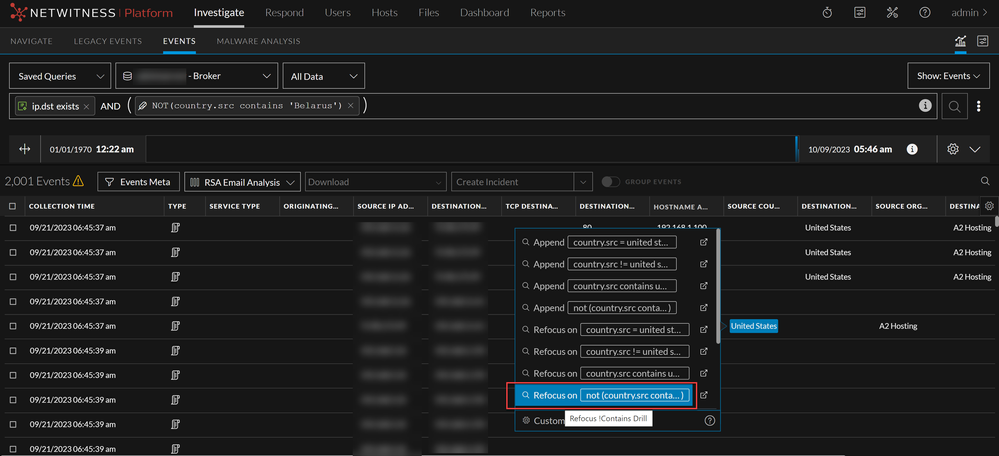
- When you select a meta value using Refocus NOT(Meta contains 'Meta value'), the particular meta value is removed from the search query results.
-
You can also Append and Refocus the meta values with Not Contains option using new tab option as shown below:


