Troubleshooting Packet Drops (11.x and above)Troubleshooting Packet Drops
Packet drops can occur if there is backup happening at Packet Pool or Session Pool on the Decoder, and eventually, Decoder runs out of free capture pages resulting in drops.
Quick configuration Checks to avoid packet drops
The Decoder would log warning messages when it encounters packet drops. These logs contain possible reasons for drops, and you can solve some of the drop symptoms through simple configuration checks.
To check and tune the configuration:To check and tune the configuration:
In most cases, the decoder configuration parameters would be different from the default configuration or with the hardware deployed. So, make sure to check the following and fix configuration issues.
-
When /var/log/messages logs show drops with reason "check capture configuration, packet sizes".
-
NwDecoder[15913]: [Packet] [warning] Packet drops encountered, packet capture (737626/737628): check capture configuration, packet sizes and rates
-
For 10G decoder run
/decoder reconfig op=10g update=1
Or
Explore view | /decoder | properties | select reconfig | op=10g update=1 | send
-
For normal decoder run
/decoder reconfig update=1
Or
Explore view | /decoder | properties | select reconfig | update=1 | send
-
The Decoder service needs to be restarted for changes to be effective.
-
Monitor decoder for drops
-
-
When /var/log/messages logs show drops with reason "check packet database configuration, iostats, packet and content calls"
-
NwDecoder[74030]: [Packet] [warning] Packet drops encountered, packet write (717957/723314): check packet database configuration, iostats, packet and content calls
-
Packet drops encountered (884632/884642): check session & meta database configuration, iostats and sdk activity.
-
For 10G decoder run
-
/database reconfig op=10g update=1
Or
-
Explore view | /database | properties | select reconfig | op=10g update=1 | send
-
-
For normal decoder run
-
/database reconfig update=1
Or
-
Explore view | /database | properties | select reconfig | update=1 | send
-
-
The Decoder service needs to be restarted for changes to be effective.
-
If we are still seeing drops, then a few more changes are required. There could be i/o bound waits for database writes on the Decoder.
-
Set /database/config/packet.integrity.flush=normal
-
Set /database/config/session.integrity.flush=normal
-
Set /database/config/meta.integrity.flush=normal
-
-
Monitor decoder for drops.
-
-
As of NetWitness Platform latest version, sosreport retrieves service and database reconfig information as well as what settings were active when the sosreport was retrieved. This information can be used for cross-checking purposes and can be found in the ..../sos_commands/rsa_nw_rest directory (service-reconfig, database-reconfig, ls<service>).
Information required to troubleshoot packet drops
-
Monitor Packet Drops Tool Output (Highly recommended)
-
This can be accessed through REST port http://<decoder>:50104/sdk/app/packetdrops
-
By default, the tool looks for drops in last 24 hrs and also provides options to search drops based on time ranges.
-
Enable detailed stats on decoder REST /decoder/parsers/config/detailed.stats=yes
What if the REST port is inaccessible?
-
Enable detailed stats on decoder
/decoder/parsers/config/detailed.stats=yes
-
Wait for new drops and then collect sosreport. The sosreport on Decoder would collect few stats db files.
-
These files can be copied to your local decoder /var/netwitness/decoder/statdb and restart Decoder.
-
Access packet drops tool on your local Decoder.
How do I troubleshoot packet drops?How do I troubleshoot packet drops?
The packet drops tool would help narrow down the possible cause for drops. There could be various cases involved that need verification.
The following sections describe how to use the Packet drops tool and analyze its results.
Navigate to the Packet drops tool using the REST interfaceNavigate to the Packet drops tool using the REST interface
-
The tool would search drop instances and list them with links.
-
Start investigating the latest drop instances where the drop count is high.
-
Look at other drop instances and find the pattern for drops.
Introduction to Drops tool ChartsIntroduction to Drops tool Charts
-
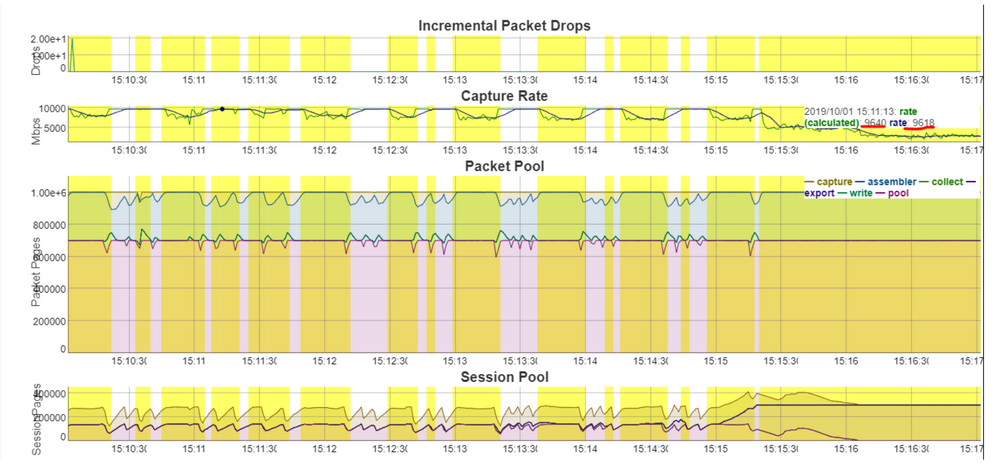
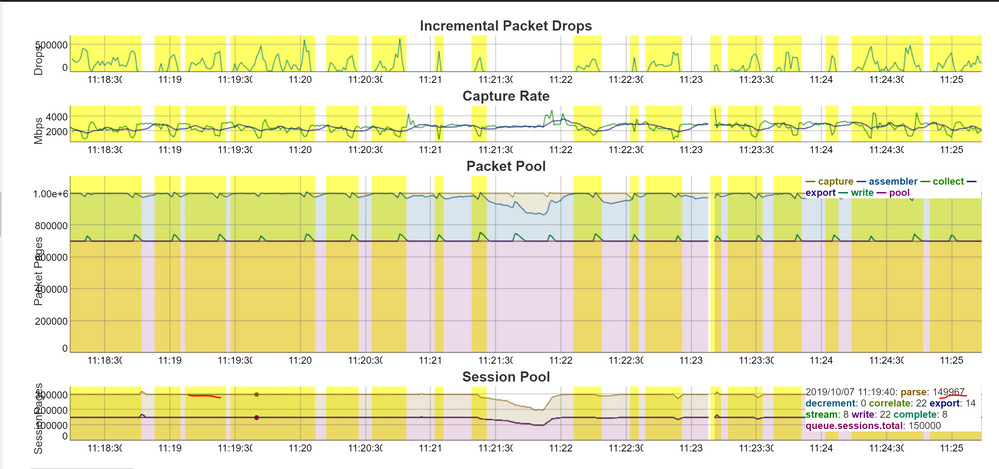
Incremental Packet Drops - Displays packet drops count at that instance of time
-
Capture - Displays traffic ingestion rates Capture.rate in Mbps and Calculated capture rate (instantaneous rate) in Mbps.
-
Packet Pool - Displays graphs for the following packet pool stats:
-
capture - /decoder/stats/pool.packet.capture → Number of free packet pages available for capture
-
assembler - /decoder/stats/pool.packet.assembler → Number of packet pages waiting to be assembled.
-
write - /decoder/stats/pool.packet.write → Number of packet pages waiting to be updated to Packet Database.
-
pool - /decoder/stats/assembler.packet.pages → Number of packet pages held in the assembler
-
export - /decoder/stats/pool.packet.export → Number of packet pages waiting to be exported
-
-
Session Pool
-
This displays graphs for following session pool stats
-
parse - /decoder/parsers/stats/pool.session.parse → Number sessions waiting to be parsed.
-
write - /decoder/stats/pool.session.write → Number of session pages waiting to be written.
-
correlate - /decoder/stats/pool.session.correlate → Number of session pages waiting to be correlated.
-
queue.sessions.total - /decoder/parsers/stats/queue.sessions.total → The total number sessions in parse threads and queues.
-
export - /decoder/stats/pool.session.export Number of session pages waiting to be exported.
When packet drops occur, the chart shows that instance of time in yellow.
Symptoms Checklist
We recommend following the symptom checks in the order listed below, and this helps to troubleshoot all the symptoms associated with current packet drops.
Symptom 1: Higher traffic ingestion rates for the content deployed would cause packet drops
If the traffic ingestion rate -( capture ) > 8 Gbps for the content (higher number of parsers) deployed on Decoder, this would cause packet drops.
ex: Below screenshot shows capture rate > 8 Gbps (9.6 Gbps)
Resolution:
Consider the following options:
-
Split the traffic ingestion into multiple decoders so that the ingestion rate would be ~4-5 Gbps
Or
-
Start with baseline supported 10G content and then add parsers one by one until no drops are observed.
-
Refer Parsing and Content Considerations section on Configure High Speed Packet Capture Capability.
-
Symptom 2: Packet Database Write backup would cause packet drops
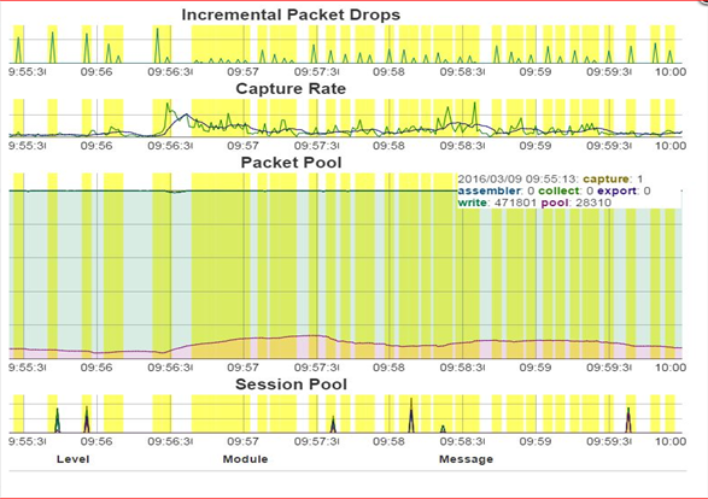
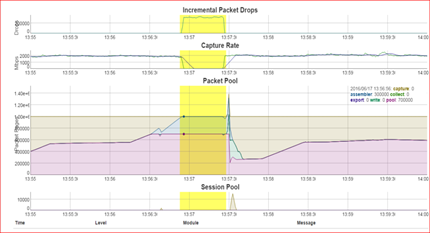
Packet Pool Write - write (pool.packet.write), if write backup increases, then packet write delays would be causing the drops
ex: Below screenshot displays, there are many packet pages (471K) waiting on the write queue.
-
Decoder logs would throw warnings like the below:
-
NwDecoder[74030]: [Packet] [warning] Packet drops encountered, packet write (717957/723314): check packet database configuration, iostats, packet and content calls
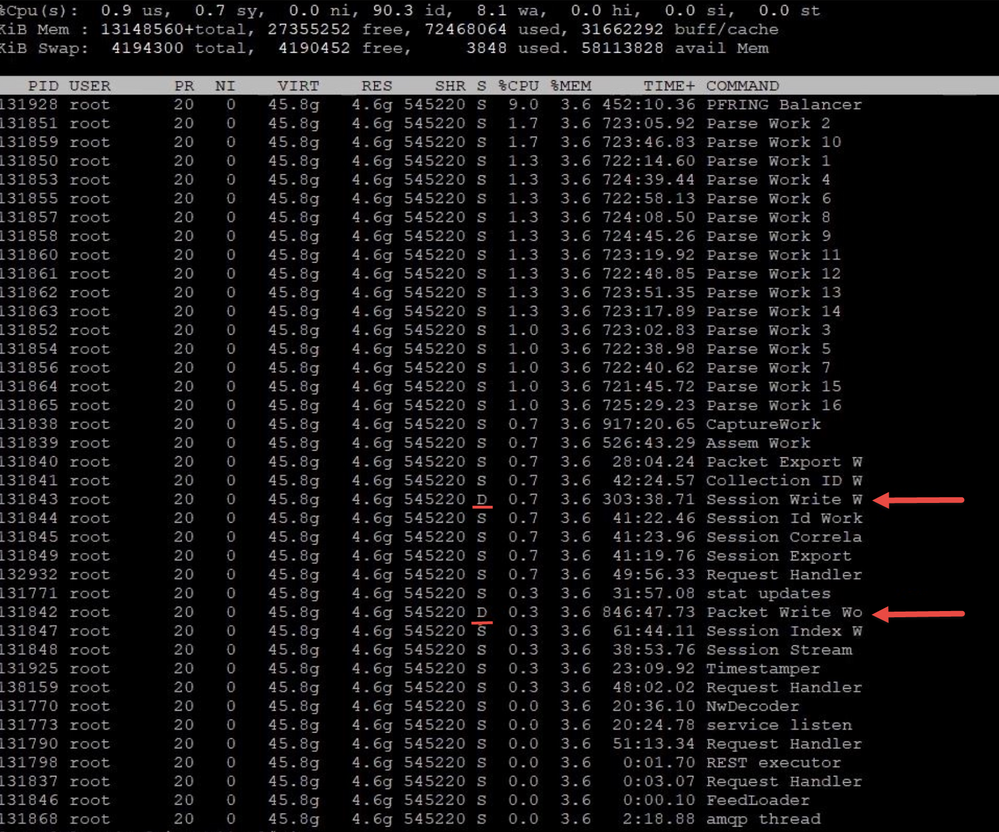
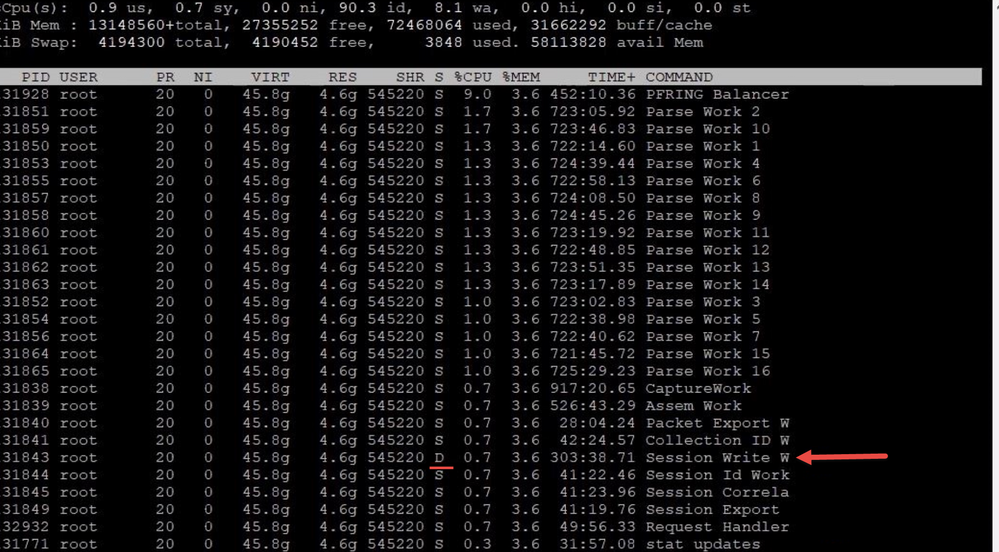
Top -Hp <Decoder PID> would display decoder packet write thread waiting on Disk.
iotop tool can show Disk i/o activity: rpm is available here and can be installed: http://mirror.centos.org/centos/7/os/x86_64/Packages/iotop-0.6-4.el7.noarch.rpm
Example iotop results where decoder packet write thread is blocked on IO 99% of decoder IO time and its throughput is just ~400KB/s
iotop –o –d 2
Resolution:
-
Make sure database configuration tuning is applied as suggested in the section To check and tune the configuration:
-
Check I/O stats on the Decoder using the command "iostat –mNx 1". Refer to How do you get statistics on I/O performance?
-
If % iowait is > 10% then decoder packet db writes have higher i/o waits
-
If % util for packetdb goes greater than 95 and wMB/s < 1000 , then Disk write throughput is low and the Disk where packetdb exists needs to be replaced.
-
If iotop is installed the disk io activity can be monitored through 'iotop –o –d 2'
-
For a 10G decoder we recommend packet db disk write throughput to be 1300 MB/s (~10Gbps ) for better write performance.
-
-
Lot of Content calls to extract packets or content can cause packet write issue.
-
Check drops tool logs or /var/log/messages or sosreport logs for SDK-Content Calls.
-
You can also use NwConsole topQuery command on messages logs to identify Content calls.
-
Set /decoder/sdk/config/packet.read.throttle=100 ( a higher value ) so that packet write would get preference.
-
Check service invoking SDK-Content calls and reduce the content calls.
-
-
Kernel and Driver compatibility issues
-
Check if the firmware is updated according to Kernel version. If not update firmware.
-
How do you get statistics on I/O performance?How do you get statistics on I/O performance?
-
The command you want to run for near real time statistics on I/O usage is "iostat -N -x -m 1". For detailed information on the output of iostat, type "man iostat". If the columns do not line up, you can leave off the -N option, but you should probably run it once so you can see what disk groups correspond to which databases.
| %user | %nice | %system | %iowait | %steal | %idle | |
| avg-cpu: | 2.41 | 0.00 | 0.22 | 5.98 | 0.00 | 91.39 |
| Device | rrqm/s | wrqm/s | r/s | w/s | rMB/s | wMB/s | avgrq-sz | avgqu-sz | await | svctm | %util |
| sda | 0.00 | 0.00 | 0.00 | 1.00 | 0.00 | 0.00 | 8.00 | 0.00 | 3.00 | 3.00 | 0.30 |
| sdb | 0.00 | 0.00 | 0.00 | 0.00 | 0.00 | 0.00 | 0.00 | 0.00 | 0.00 | 0.00 | 0.00 |
| VolGroup-lv_root | 0.00 | 0.00 | 0.00 | 0.00 | 0.00 | 0.00 | 0.00 | 0.00 | 0.00 | 0.00 | 0.00 |
| VolGroup-lv_home | 0.00 | 0.00 | 0.00 | 0.00 | 0.00 | 0.00 | 0.00 | 0.00 | 0.00 | 0.00 | 0.00 |
| VolGroup-lv_swap | 0.00 | 0.00 | 0.00 | 0.00 | 0.00 | 0.00 | 0.00 | 0.00 | 0.00 | 0.00 | 0.00 |
| VolGroup-lv_nwhome | 0.00 | 0.00 | 0.00 | 1.00 | 0.00 | 0.00 | 8.00 | 0.00 | 3.00 | 3.00 | 0.30 |
| VolGroup-lv_tmp | 0.00 | 0.00 | 0.00 | 0.00 | 0.00 | 0.00 | 0.00 | 0.00 | 0.00 | 0.00 | 0.00 |
| VolGroup-lv_vartmp | 0.00 | 0.00 | 0.00 | 0.00 | 0.00 | 0.00 | 0.00 | 0.00 | 0.00 | 0.00 | 0.00 |
| VolGroup-lv_varlog | 0.00 | 0.00 | 0.00 | 0.00 | 0.00 | 0.00 | 0.00 | 0.00 | 0.00 | 0.00 | 0.00 |
| sdc | 0.00 | 0.00 | 0.00 | 0.00 | 0.00 | 0.00 | 0.00 | 0.00 | 0.00 | 0.00 | 0.00 |
| sdd | 0.00 | 0.00 | 242.00 | 0.00 | 30.25 | 0.00 | 255.97 | 1.98 | 8.14 | 4.13 | 100.00 |
| sde | 0.00 | 0.00 | 0.00 | 0.00 | 0.00 | 0.00 | 0.00 | 0.00 | 0.00 | 0.00 | 0.00 |
| index-index | 0.00 | 0.00 | 0.00 | 0.00 | 0.00 | 0.00 | 0.00 | 0.00 | 0.00 | 0.00 | 0.00 |
| concentrator-root | 0.00 | 0.00 | 0.00 | 0.00 | 0.00 | 0.00 | 0.00 | 0.00 | 0.00 | 0.00 | 0.00 |
| concentrator-sessiondb | 0.00 | 0.00 | 141.00 | 0.00 | 17.62 | 0.00 | 255.94 | 0.81 | 5.84 | 5.77 | 81.30 |
| concentrator-metadb | 0.00 | 0.00 | 102.00 | 0.00 | 12.75 | 0.00 | 256.00 | 1.17 | 11.39 | 9.75 | 99.40 |
-
In the above sample output, you can see the session and meta DBs (last two lines) are reading in about 30 MB/s combined. You can also see that sdd corresponds to those two databases, since the numbers combined roughly add up. The important takeaway is the last column, %util. This means: Percentage of CPU time during which I/O requests were issued to the device (bandwidth utilization for the device). Device saturation occurs when this value is close to 100%. Therefore, the disks are currently saturated with read requests and the databases are currently I/O bound. When measuring performance of the SA Core services, it's important to know if the software is I/O bound. This would be the limiting factor for increasing performance as the current hardware is running at capacity.
-
To determine which physical volume the index is on, run "vgdisplay -v index". In the above example, it's /dev/sde. To see a list of volumes, run "vgdisplay -s".
-
Run "ls -l /dev/mapper" to see the drive mappings.
Symptom: Session Database Write backup would cause packet drops
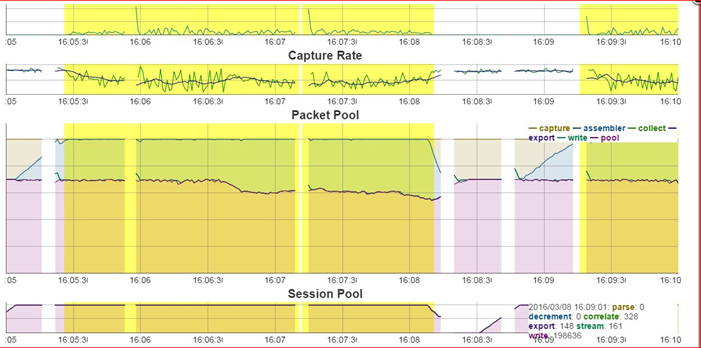
Session Pool Write - write (pool.session.write), if session write backup increases, then session write delays would be causing the drops
ex: Below screenshot displays there are many session pages (198K) waiting on session write queue
Decoder logs would also throw warnings like below:
-
Packet drops encountered (884632/884642): check session & meta database configuration, iostats and sdk activity.
Top -Hp <Decoder PID> would display decoder packet write thread waiting on Disk.
iotop tool can show Disk i/o activity: rpm is available here and can be installed: http://mirror.centos.org/centos/7/os/x86_64/Packages/iotop-0.6-4.el7.noarch.rpm
Example iotop results where decoder session write thread is blocked on IO 99% of decoder IO time and its throughput is just ~30KB/s
iotop –o –d 2
Resolution:
-
Make sure database configuration tuning is applied as suggested in section To check and tune the configuration:
-
Aggressive aggregators from Decoder
-
Check aggregators using /decoder whoAgg or Explore /decoder | properties | select whoAgg | send
-
Many aggregators with nice disabled (false) in their configuration can cause session pool backup.
-
For Archiver and Warehouse Connectors nice should be enabled (true).
-
For Concentrator nice should be disabled (false).
-
-
If there is one device aggregating from Decoder then it would mostly be Concentrator, don't enable nice on Concentrator.
-
If there is an Archiver or Warehouse Connector then set aggregate.nice=true On Warehouse Connectors and Archivers aggregating from Decoder.
-
-
Check I/O stats on the Decoder using command "iostat –mNx 1". Refer to How do you get statistics on I/O performance?
-
If % iowait is > 10% then decoder session db and metadb writes have higher i/o waits
-
If % util for sessiondb or metadb goes greater than 95 and wMB/s < 1000 , then Disk write throughput is low and the Disk where sessiondb and metadb exists needs to be replaced.
-
If iotop is installed the disk io activity can be monitored through 'iotop –o –d 2'
-
For a 10G decoder we recommend sessiondb and metadb write throughput to be 1300 MB/s (~10Gbps ) for better session write performance.
-
-
Lot of Content calls to extract meta or content can cause session write issue.
-
Check drops tool logs or /var/log/messages or sosreport logs for SDK-Content Calls
-
You can also use NwConsole topQuery command on messages logs to identify Content calls.
-
Set /decoder/sdk/config/packet.read.throttle=100 ( a higher value ) so that packet write would get preference.
-
Check service invoking SDK-Content calls and reduce the content calls.
-
-
Kernel and Driver compatibility issues
-
Check if the firmware is updated according to the Kernel version. If not, update firmware.
-
Symptom: Session Pool Parsing delays causes packet drops (Parsing issues)
Session Pool Parse - parse (pool.session.parse): If session parse backup increases, then sessions would be queued on assembler and would be causing the drops.
ex: Below screenshot displays there are many sessions waiting to be parsed - Session Pool | parse stat.
Decoder logs would throw warnings like the below:
NwDecoder[42946]: [Packet] [warning] Packet drops encountered, packet assemble (910178/910179): check session pool (following log), line and session rates
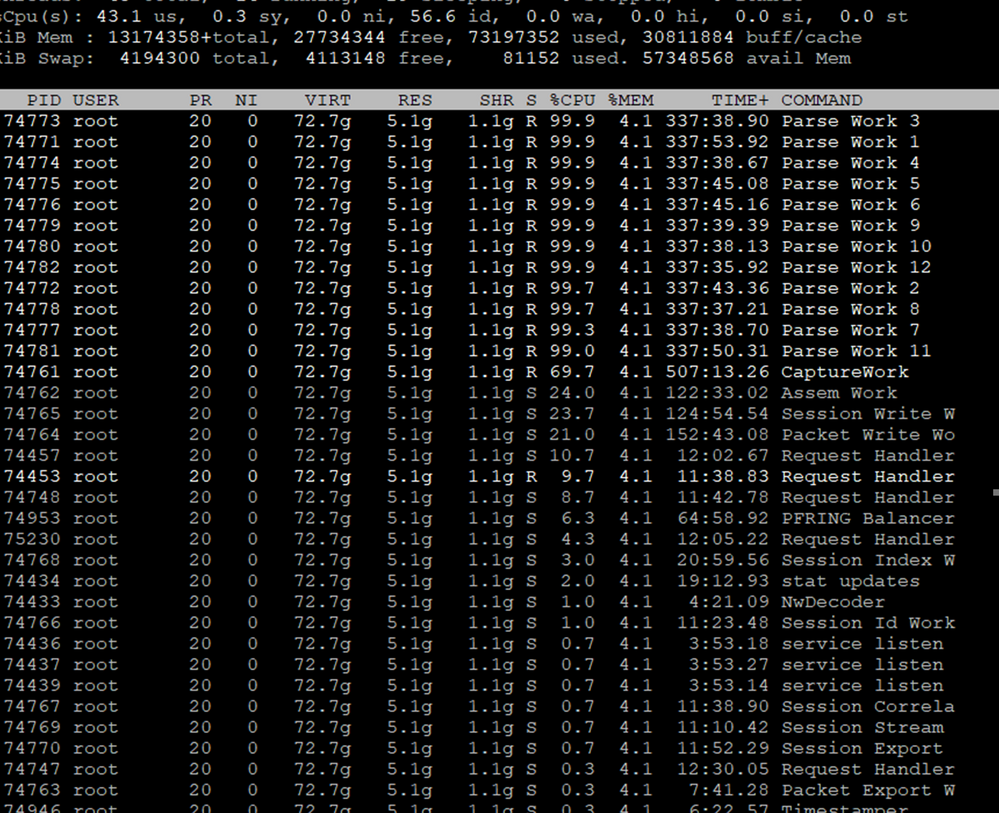
top -Hp <Decoder pid> would display decoder Parse Work (Parser Threads) are so busy with high CPU usage.
Resolution:
-
Enable parser detailed stats on decoder /decoder/parsers/config/detailed.stats=yes, wait for new drop instance.
-
Click on
to analyse parsing activity.
-
Click on Top Parsers CPU usage, this displays top 5 parsers using higher cpu usages.
-
Try to disable the parsers which are using high CPU usage and wouldn't be parsing the larger percentage of traffic and monitor decoder for drops due to parsing.
-
For ex: parser like TLS_lua , TLD_Lua has higher CPU usage than HTTP_lua (which parsers larger percent of traffic).
-
-
Repeat the above step till packet drops are reduced or resolved
-
Notify parser Content owner (Customer - if it is their custom content or NetWitness Content team if it is NetWitness parser) so that a fix may be provided for parser issue.
-
-
Click Top Parsers Token Callback counts, this displays top 5 parsers having higher token callback counts during the drop window.
-
Try to disable the parsers which are using high Token Callback count and wouldn't be parsing the larger percentage of traffic. Monitor decoder for drops due to parsing.
-
For ex: parser like TLS_lua has higher Token Callback count than HTTP_lua (which parsers larger percent of traffic)
-
-
Click Top Parsers Meta Callback counts, this displays top 5 parsers having higher meta callback counts during drop window.
-
The parsers which displays higher Token Callback count and does not generate much meta and wouldn't parse larger percent of traffic, needs to be disabled.
-
Disable such parsers and monitor Decoder.
-
-
Click Top Parsers Memory Usage, high Lua memory usage (>1 Gb per parser) or memory spike can cause packet drops.
-
Disable Lua Parsers which are using higher memory usage > 1 Gb and monitor Decoder for drops.
-
-
Complex App rules including "regex" or "contains" are CPU intensive
-
Check Parsers CPU Usage graph, if there is high CPU usage for cpu.app.rules stat, then check the app rules configured and tune them.
-
Symptom: Session Parsing stuck can cause packet drops
Session parsing got stuck at a parser would show symptom of graph like below where queue.sessions.total =1 on Session pool.
Decoder would log warning message like:
NwDecoder[42946]: [Packet] [warning] Packet drops encountered, packet assemble (910178/910179): check session pool (following log), line and session rates.
Resolution:
-
Enable parser detailed stats on decoder /decoder/parsers/config/detailed.stats=yes, wait for new drop instance.
-
Click on Analyse Parser Stats to analyse parsing activity.
-
Click on Top Parsers CPU usage, this displays top 5 parsers using higher cpu usages.
-
The parser which shows CPU usage when Session Pool queue.sessions.total =1 would be the one got stuck or looping.
-
Disable the parser and monitor for drops . Notify parser Content owner to get the fix.
-
Symptom: Lua Parser Warnings can cause packet drop issues
A lua parser which throws warnings and errors can affect the parse thread and its cpu cycles, hence if there is any lua parser which is throwing warnings then it needs to be fixed.
Resolution:
-
Identify and disable the lua parser throwing errors or warnings and monitor decoder.
-
Create a content ticket so that content owners can provide a fix or workaround.
ex: Lua Parser throwing parse failure for execution limits exceeding.
