Filter Results in the Events View
Filtering events in the Events view helps to narrow the focus of an investigation to a smaller, relevant set of events. You can filter events in the Events view using the Events Meta panel, the options in the query bar, and the options in the Events panel.
Initial Filter Using the Query Bar
When initially opening the Events view, the most basic filtering is to select a service, and time range and then query the service in the query bar. This returns a list of matching events in the Events panel. You can also select a query profile (Version 11.4 and later) and build a query to look for events that contain certain meta keys, meta values, and text in the query bar.
This figure illustrates the Version 11.4 and earlier query bar with the options to select a query profile, service, and time range to filter events and load them in the Events panel. Two modes are available Guided Mode and Free-Form Mode.
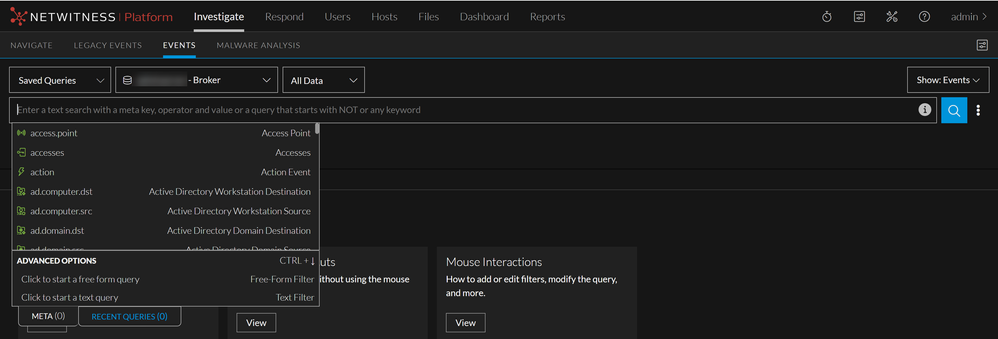
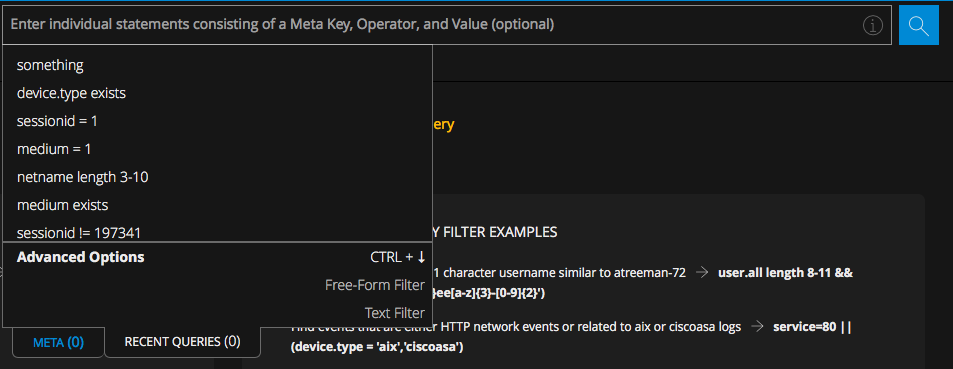
This figure illustrates the Version 11.4.1 and later query bar in which the Guided and Free-From Modes are no longer necessary. The simplified filter entry form allows you to use advanced auto-suggest options and also to enter a free-form query.
-
The Query Profiles menu is available in Version 11.4 and later. You can encapsulate a query and a column group in a profile so that a useful combination of attributes is easily recalled and applied to a set of events in the Events panel (see Use Saved Queries to Encapsulate Common Areas for Investigation.)
- By default, the first service is automatically selected (unless you previously selected a service and the selected service is in browser cache). You can select a service as described in Begin an Investigation in the Events View
- If you do not select a time range, the default time range (24 hours) is used.
- The query builder field is an empty field to the right of the time range selector. This is where you build a query by creating filters. Clicking
submits the query and sends a request to the selected service to load the data. Clicking the
(Query Console) > Current Query tab, shows detailed status of the current query (see Filter Results in the Events View below).
- When you go to the Events view from the Legacy Events view or the Navigate view, the service, time range, and any filters that were selected in the Legacy Events view or Navigate view are displayed in the query bar. The service, time range, and individual filters can be modified.
- If a profile is selected in the Legacy Events view when you right-click or double-click an event and go to the Events view, the filters from the profile (preQuery) are added to the query builder field as an editable filter. The following figures show a preQuery in the Legacy Events view, and the same query added as the first filter in the Events view.
Find a Text String in the Events Panel
With the Events panel open, you can search for a text string in the list of events. This search is similar to the CTRL-F search in a browser window. The search scans all text in every row of the table, visible columns only, to find matching text and highlights the matches. Columns that are not displayed are not searched. The search function is disabled if the Summary column is part of the table.
- With events loaded in the Events panel, click
on the right side of the toolbar.
- In the Find Text in Table dialog, start typing a text string.
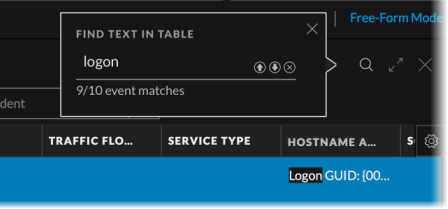
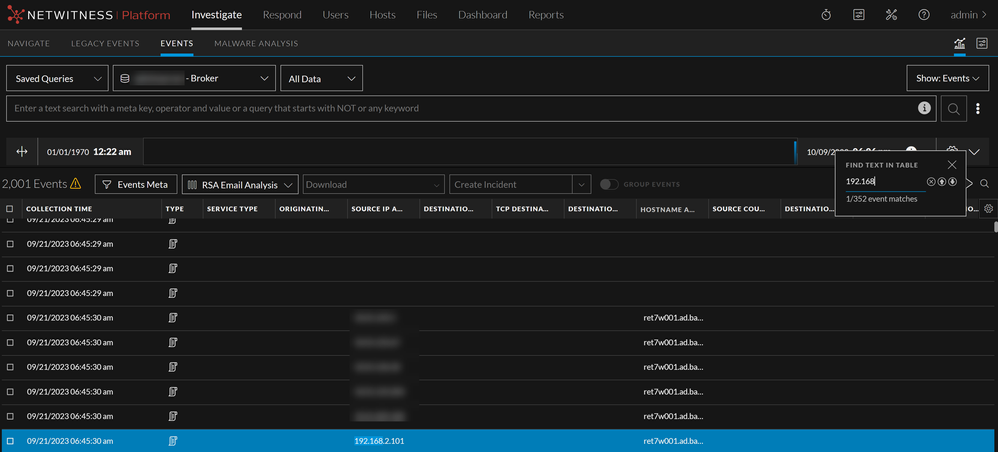
After you type two characters, exact matches of the text string without regard to case are highlighted in the Events panel. As you type more text, highlighted events are further refined. The following figure is an example of the results found after entering "192.168" in the Find Text in Table dialog. The text string was found in 10 events. The first event is highlighted in blue with the text string within the event also highlighted. Icons are available for navigating the search results and closing the dialog. - To navigate through the search results, click the up and down arrows.
- To view the next event that contains the text string and navigate downward through the search results, click the down arrow. If you click the down arrow when viewing the last result, the first result is highlighted.
- To view the immediately prior event that contains the text string and navigate upward through the search results, click the up arrow. If you click the up arrow while viewing the first result, the last result is highlighted.
- To close the search dialog, click X or press the ESCAPE key. The dialog also closes if you open a reconstruction, select a new column group, or execute a new query.
Refining the Results in the Events Panel
After the initial filter and query submission, you can continue to use the options in the query bar to refine results, with two added methods of filtering the results.
- You can use column groups to optimize the number or attributes (meta keys, meta groups, meta entities) you look at for a given event (see Use Columns and Column Groups in the Events List).
- You can filter events by exploring meta keys and meta values in the results in the Events Meta panel, which is a Beta release feature. This allows you to pivot through the metadata as you can in the Navigate view, and offers the added convenience of immediately seeing the matching events in sequence in the Events panel based on your drill point. The administrator can enable or disable this feature as describe in the System Configuration Guide.
Filter Meta Information using Events Meta Panel
Analysts can filter meta keys and meta values from the Filter Events panel using the newly added Filter option. This enhancement allows analysts to refine their search results by entering specific meta values or keys and helps analysts to investigate seamlessly rather than scrolling through a long list of metadata.
To Filter meta keys or meta values from the Events Meta Panel
-
Go to Investigate > Events and click
to load events.
The events for the selected service and the selected time range are loaded in the Events panel.
-
To display the Filter Events panel, click Filter before the Events panel.
The Filter Events panel opens to the left of the Events panel.
-
To filter the listed meta values or keys by name, type some text in the Filter field. The list is updated to show only the names that contain the exact text with the blue background highlighted.
Query Builder ConceptsQuery Builder Concepts
In the query builder, you can reduce the number of events to an interesting set by creating three types of filters: simple, free-form, or text.
The basic syntax for each filter is as follows: <meta key><operator><meta value>. Here is an example: direction = 'outbound'.
When you type or paste a query in the query bar, the text is parsed into individual filters separated by the AND operator if the parsing engine determines that AND is needed. Earlier versions use only the AND operator between filters, and the logical operator is not visible.
- If you type action = 'get' action = 'put', the result is two filters separated by AND.
- If you type action = 'get' OR action = 'put', the result is two filters separated by OR.
When typing or pasting a filter for event.time, use one of the following formats:
- event.time = '2020-DEC-02 23:00:00'
- event.time = '2000-12-20 21:00:00.000'
- event.time = '2000-12-20 21:00:00'
The parsing engine converts a longer string of text that you type or paste in the query bar into individual filters. Parts of the filter that are not parsable are converted to a free-form filter. In earlier versions, a long text string is added to the query bar as a single filter. Further enhancement provides the ability to keep typing text for any query, where you type a meta key and an operator or an operator and a value, as a free-from query. The free-from query is parsed as usual.
- If you type, action = 'GET' OR action is 20 || action = 'PUT' in the query bar the Free-Form option is used. Part of this text cannot be parsed so the result is three filters separated by OR. The following figures show the query bars of version 11.4 and version 11.6 respectively.
- In Version 11.4.1, If you type a meta key-operator-value sequence and you continue typing without pressing Enter, the Free-Form option is automatically used so that you can continue typing the query. For example, you can type medium = 1 OR medium = 2 without pressing the Enter key before OR. The Free-Form option is highlighted while you type and when you press Enter at the end, a free-form filter is created in the query bar.
- Text filters (Version 11.4 and later) are text strings that do not contain spaces. You can search the data set for any exact match of indexed meta keys, not all meta keys. Here are some examples: failed, login, or attempt.
Note: In some cases, when you are typing a text filter that is close to matching a meta key and operator statement, the auto-suggest feature erroneously suggests a filter using the meta key and operator. The workaround is to begin typing the text and select Text Filter at the point where the auto-suggest feature turns the text into a meta key and operator. For example, there is meta key named crypto, and an operator named contains, and you want to create a text filter to search for cryptocurrency. As you type c-r-y-p-t-o, the next c in "currency" triggers the contains operator instead of continuing to type as a single word. To complete the text filter, right before typing that c in currency, which would trigger the contain operator, highlight the Text Filter option to let the system read the input as text filter.
In the query builder, each filter becomes an editable field. Filters line up from left to right, representing the sequence in which the filters were created. As more filters are added and exceed the length of a single line, they wrap to another line and the input area expands vertically so that all filters are visible without scrolling to the right.
Guided Mode vs. Free-Form Mode
Note: Version 11.4 offered two modes for entering queries in the filter entry form: Guided Mode and Free-Form Mode. Beginning with Version 11.4.1, the powerful auto-completion features and suggested values of Guided Mode and the ability to type or paste a free-form query are fully integrated. References in this document that differentiate between Guided Mode and Free-Form Mode are for analysts using Version 11.4.0.x and earlier.
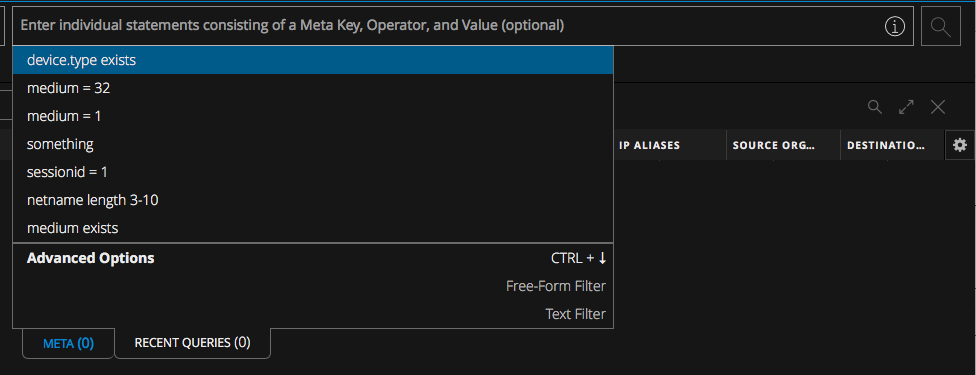
In Guided Mode, you are guided with suggestions for auto-completion that show valid meta keys and operators, and suggested values in the filter entry form. In version 11.4, you can type, paste, choose a recent query, or select from the drop-down menu. Earlier versions do not support pasting text and recent queries. This is an example of the 11.4 filter entry form.
As you create filters, the syntax of each filter is validated and invalid filters are marked by a red outline. If you hover the mouse over the filter, a message that explains the error is displayed.
In Version 11.3 and later, free-form filters are validated on the server side, which may take additional time. If you submit the query before the server has returned filter validation results, the 
In Free-Form Mode, you can type or paste a long text string. There is no auto-suggestion, and validation is performed on the server side when you submit the query. If an error is found, the query does not execute.
Note: The 
Clicking Guided Mode or Free-From Mode toggles between modes. If you selected Free-Form Mode the last time you logged in, this choice is stored in browser cache and is used until the browser cache is cleared.
- When you switch from Guided Mode to Free-Form Mode, filters that you created in Guided Mode are transformed to a text query in the Free-Form field.
- When you switch from Free-Form Mode to Guided Mode, the query you were typing is added to the query bar as individual simple filters, but it does not include auto-suggest options.
Note: Before Version 11.3, a Free-Form filter could not be edited in Guided Mode.
The following figure is an example of the query bar with the Guided Mode query builder with several filters.
The following figure is an example of the Free-Form query builder in use.
Concepts for Editing Multiple Filters
As you work in the query builder, you can see when a filter has focus for editing (a green outline) and which filters are selected (blue background). This is useful because you can have multiple filters selected for right-click actions, but only one can be edited at a time. The figure below shows the green outline marking a filter that has focus and the blue background indicating that two filters are selected.
This figure illustrates the same set of filters with all filters selected (blue background) and one filter that has focus (blue background and green outline).
A right-click action from the drop-down menu applies to all selected filters as shown in this figure showing Version 11.4 options.
In Version 11.4.1, the menu has two new copy options as shown in the following figure. The options allow you to share the clipboard contents with other analysts or paste the contents to the query bar. You can:
- Select a single filter, right-click it, and then copy the entire query to the local clipboard.
- Select multiple filters, right-click one of them, then copy the selected filters.
These are a few basic concepts that explain how to work in the query builder:
- You can select multiple filters, but only one can have focus and the last selected filter is the one with active focus at any point in time.
- To select a filter and give it focus, click the filter. To deselect the filter and remove focus, click the filter again, press Esc, or click anywhere else on the page.
- To add a filter, click before or after an existing filter. To create a new filter before or after the filter in focus, press the right or left arrow key.
- To open a filter for editing, double-click the filter or click it and press Enter. To exit without saving changes and leave the filter in focus, press Esc.
- To delete a filter, click the filter and press Delete or click X on the filter.
- (Version 11.6) If a filter is awaiting user's input, it is highlighted with blue color
.
- (Version 11.6) An invalid filter is highlighted with red color.
- You can hover over the filters in the query bar to display tooltip messages.
The Version 11.4 Query Builder
You can type; select meta keys, operators, and values from the drop-down menus; or paste a filter in the query bar. Added 11.4 features in the Guided Mode filter entry form are described in detail below.
Meta Keys Cached for Faster Loading
When the Events view opens, meta keys from all connected services are cached for faster data loading. These meta keys are available in user interface elements that have auto-suggest meta keys. (When you are building a column group or profile, if you are expecting to see a meta key and it is not displayed, select the service where the key was added to force a cache update. This usually occurs only when a meta key is not added to all concentrators.)
Text Filter
You can create a text filter to find a text string in the data set which is indicated with 
Pasting Text Instead of Typing
When creating a filter, you can paste a meta key or value in the filter entry form. When you paste text into the filter entry form instead of typing the text, the text is parsed appropriately to create one or more filters. Any portion of the text that cannot be parsed is converted to a free-form filter.
Select All Filters and Copy All Filters (Version 11.4.1)
While creating a filter in the Events view query bar, you can use keyboard commands to select all filters (Cmd-A for MacOS, Ctrl-A for Windows) and then copy the selection to the clipboard (Cmd-C for MacOS, Ctrl-C for Windows). The clipboard text is available to share with other analysts or to paste in the query bar using Cmd-V or Ctrl-V).
Use of Recent Queries
The filter entry form offers two methods of entering meta keys, operators, and values: the Meta tab and Recent Queries tab. The Meta tab is the same as the filter entry form for prior versions except that a count of matching results is given in the tab label and icons mark meta keys that are indexed by key, indexed by value, and not indexed. In the Recent Queries tab, up to 100 recent queries are displayed. The list is filtered as you type to show only queries that contain the typed text, and you can select a query from the list.
Use of Advanced Operators
Auto-suggest can parse the following advanced operators that you paste or type into the filter entry form: <, >, <=, >=, OR, ||, AND, &&, (), regex, and length. The text is parsed as multiple filters. For example, if you type or paste medium > 0 && medium <= 100, the text is parsed as two simple filters with an explicit AND operator: medium > 0 AND medium <= 100. If you type or paste bytes.src <= 5000 && medium = 1 || medium = 2 && bytes.src > 0, four simple filters are created with AND and OR operators separating them: bytes.src <= 5000 AND medium = 1 OR medium = 2 AND bytes.src > 0 to make as many valid filters as possible.
This filter is an example of a filter in which it would be useful to add parentheses. You can select medium = 2 and bytes.src > 0, then right-click and select Wrap in Parentheses from the drop-down menu. Text filters are not supported inside parentheses.
The resulting query is bytes.src <= 5000 AND medium = 1 OR (medium = 2 AND bytes.src > 0).
If you encounter errors while creating filters, look for tooltip messages and check the documentation.
Easy Use of AND/OR Operators
When you type ||and &&, they are displayed as OR and AND in the query bar. You can change OR to AND and AND to OR by clicking the word. When you insert the cursor to add a filter, the AND operator is added before the cursor. When you delete a filter, orphaned OR and AND operators are removed. The operator for a text filter must be AND because text filters are always ANDed to a query.
Automatically Balanced Parentheses
When creating and editing filters in the query builder, parentheses pairs are automatically balanced as you type. If you type an open parenthesis in a filter that is open for editing or before a selected filter, the close parenthesis is added at the end of the filter. This works intuitively as you type so that you can add new filters on either side of the parenthesis and between parentheses when there are nested parentheses. Orphaned parentheses are automatically removed. If adding parentheses would create an invalid filter, the parentheses are not added. You can also right-click selected filters, and add parentheses using the Wrap in parentheses option. This option is only available when the result would be a valid filter.
Hints about Available Values
For properly indexed meta keys, the user interface provides hints about available values related to the time range of the query. Up to 100 suggested values are returned and, when you type text, the list of 100 values is filtered to include only relevant values. If no matching values are returned, a message advises "No suggestions found." (The suggested values are based solely on the time range; filters in the query do not filter the list of 100.)
CIDR Notation and Shorthand
When entering a value for an IP address in a filter, you can use CIDR notation to filter for addresses within a range.
The IPv4 CIDR block range is 0 to 32. For example 10.20.30.0/24 specifies 10.20.30.0 with a subnet mask of 255.255.255.0, which will match an IP in the range 10.20.30.0 through 10.20.30.255.
The IPv6 CIDR block range is 0 to 128, for example, 1203.0fe1:fe82:b896:89b0:8a7c:99bf:323d/32 specifies 1203:0fe1:0000:0000:0000:0000:0000:0000 through 1203:0fe1:ffff:ffff:ffff:ffff:ffff:ffff:ffff.
You can also use shorthand to remove groups of zeros or leading zeros in a group in IPv6 addresses, for example,
1203:fe1::
There must be no spaces between the IP address and the CIDR mask that you are using.
Ranges or Series of Values
For meta keys that have numerical data, you can use a range of values, a series of values, or both to filter data. For example, this query has a comma-separated list, and two of the values in the series are ranges src.port = 0-1023, 1024-1050, 65535. If a comma is a part of a value, the value must be wrapped in quotes. For example, get,post is interpreted as two separate values, while 'get,post' is interpreted as one value. A range of values must be a valid range of positive integers, separated by a dash (with our without a space before and after). The first number in the range must be smaller than the second. For example, 0-1023 and 0 - 1023 are valid ranges, but these are not valid ranges: -10 - 50, 50 - 10, 50.8 - 60.2, 50 - 70x.
No Separating Space Required After Meta Key and Operator
Filters in the query bar need a space between the meta key and the operator, and between the operator and the value. Operators must be typed with a separating space in the filter entry form in order to use the auto-suggest functions for operators and values. To improve the user experience when typing a query, the filter entry form accepts operators typed with no separating space after the meta key. When you type an operator with no separating space, a value is auto-suggested as usual and a space is added between the meta key and the operator. When you type an operator and a value without a separating space, the space between them is automatically added.
Select a Time Range
The Time Range selector limits the events returned in the Events view to a specific time range. The time range is displayed in the format Start Time - End Time, showing the date, hours, and minutes in your current timezone based on timezone settings configured for your profile. In Version 11.3 and later, you can choose a time range relative to the current collection time or create a custom time range. The time and date format is based on preferences set for the Events view in the User Preferences dialog (select 
- By default, the date format is MM/DD/YYYY. You can change the format to DD/MM/YYYY, or YYYY/MM/DD in the User Preferences dialog.
- Start time and end time are in the format of HH:MM. Although seconds are not displayed, the value for start time always defaults to HH:MM:00 seconds, and the value for end time always defaults to HH:MM:59 seconds. As an example, a time range of 6:45 pm - 7:45 pm is interpreted as 06:45:00 - 07:45:59 pm.
- The default time range is the 24-hour clock; you can change it to 12-hour periods.
Note: By default, the time format for downloads is Epoch format, which shows the time as a numerical value representing the number of seconds from the Unix epoch, January 1, 1970. The resulting number requires a conversion to be understood. Your administrator can change the setting for time format in downloads to combine your user preference time zone, date format, and time format into an easily understood representation, which follows the industry standard ISO 8601 representation when possible. Given this time: 04/13/2020 09:17:36 am with timezone US/Pacific (GMT-7:00, this is an example of the time on the 12-hour clock as it appears in the user interface: 04/13/2020 09:17:36 am. In the download, Epoch format would represent the time as 61547519856000. If your administrator set the time format for downloads to the easily readable representation, the same time would be represented as follows: 04-13-2020T09:17:36AM-07:00.
The time format for a query is based on preferences set for the Events view in the Event Preferences dialog (select 
To edit the time range, do one of the following:
-
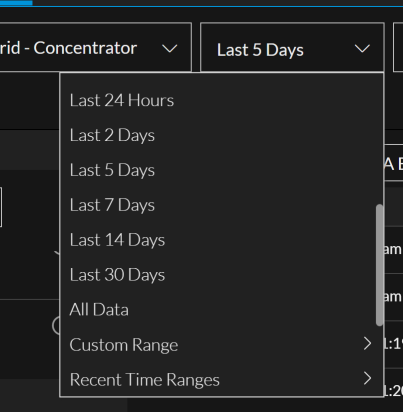
Click the drop-down arrow inside the Time Range selector and select a time range from the list. Options are in minutes, hours, days, or all data.
Edit the time range directly by clicking the year, month, day, hour, or minute displayed in the query bar. When a value is highlighted, type a new value for either the start or end time. If your time format preferences are set to 12-hour periods, click am or pm to toggle between the two options.
If the time range is invalid (for example, the start time is later than the end time), a red border appears around the Time Range selector. The 

The selected time range is stored in your browser for the service being queried; you can set different time ranges for different services. A tool tip shows the calculated duration of the query. The following figure is an example of the tool tip.
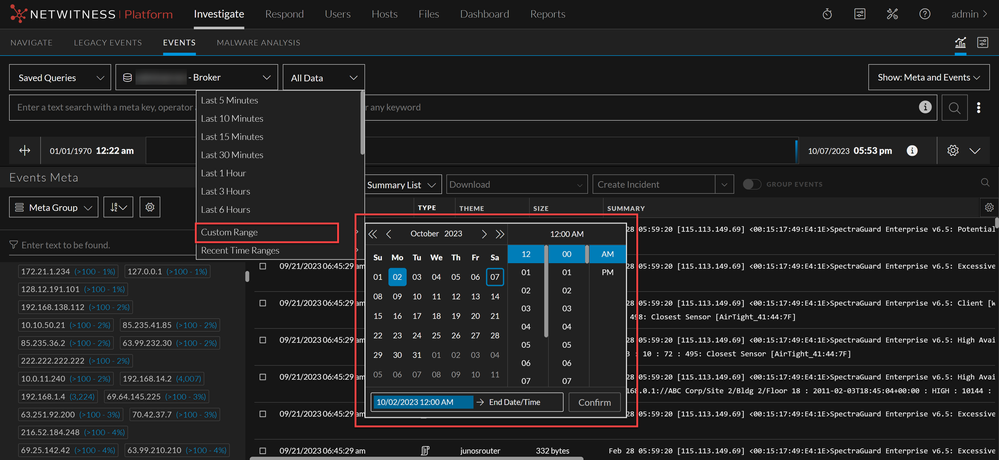
In 12.0 and later, in addition to the existing options, the Custom Range option in Investigate Events view allows analyst to select a specific time, date, month, and year or a date range to run a query and filter events. On clicking the Custom Range option, a calendar view is displayed with a current day, time, and date details. This enhancement helps the analysts to select date and time quickly and avoid manual intervention therefore avoiding human errors (typos).
The analyst can use the following to navigate within the calendar:
and
to toggle between months.
and
to toggle between years.
to select a specific time.
to select the start date and time.
to select the end date and time.
to select an year and the year range.
- Click Confirm to save the selection.
Submit a Query
The 


- If you change the service in the query bar or change the column group in the Events panel, a network call for data for a reconstruction in the Events panel continues to use the previous service, time range, and metadata filters until you submit the new query. The
button becomes active as an indicator that the data in the view is stale.
- If more than a minute has passed and the original query's time range would no longer generate the same result set, the
button becomes active as an indicator that results may be stale. In Version 11.3 and later, a setting in the Events view preferences determines this behavior by enabling or disabling the Update Relative Time Window Automatically option (see Configure the Events View.)
Cancel Execution of a Query
After you click 


If the query is canceled before all results have been returned, the following message is displayed at the end of results in the Events list: "Because the query was canceled, only partial results are displayed."
View Status of a QueryView Status of a Query
After a query is submitted, you can click the Query Console icon () > Current Query in the query bar to see which service, time range, and metadata was queried as well as real-time information about the status of the query and the services being queried. The time range displayed in the Query console always shows each date as YYYY-MM-DD. Here is an example range from the Query Console: "2014-09-20 20:57:00"-"2018-11-02 18:57:59".)
The following figure is an example of the Query Console for Version 11.3 when a query executes successfully and the slowest service is marked by an amber stopwatch.
The following figure is an example of the information in the Query Console after a query that includes a text filter executes. Notice that the query is shown in two fields, Meta Filter and Text Filter.
While a query is executing, a progress bar indicates the query's completion percentage at the bottom of the console. The status lets you know details about what is happening; for example, you can tell when the query is executing, queued, reading the index file for the queried service, retrieving events, and complete. All statuses and non-fatal messages are displayed as they come in, and the border color of the query bar changes to amber if a non-fatal error occurs.
Icons provide additional information about individual services.
- An amber stopwatch marks the slowest service.
- An amber triangle indicates a warning was received.
- A red triangle shows that an error was received when trying to query the service.
Executing and Reading the Index File to Find Events. The first stage of a query is complete when the queried services have found results. The query console provides a nested hierarchical listing of all the services being queried with indicators showing which are online or offline, and the time in seconds that the service took to find results.
Retrieving Events and Loading in the Events Panel. While the found events are being retrieved and loading in the Events panel, the progress bar shows a visual indicator and text description of what is happening. In the figure below, results were found and are being retrieved.
Request Complete. If there are no errors or warnings when loading is complete, the query console is outlined in blue and the 
Errors and Warnings. A fatal error such as a syntax error in the query, or the queried service being offline, stops execution of the query. A red triangle is displayed in the upper right corner of the query console, and the console is outlined in red to indicate that the query failed. If the queried service is offline, only the queried service with no hierarchy of services is listed in the query console and marked by a red triangle.
A non-fatal error does not prevent a query from executing. The query is executed and events are loaded, but a red triangle is displayed in the upper right corner of the query console, and the console is outlined in red as a warning. The following figure shows the appearance of the query console when the queried service proxies to another service that is offline.
A warning does not prevent a query from executing. The query is executed and events are loaded, but an amber triangle is displayed in the upper right corner of the query console, and the console is outlined in amber.
Build a Query in Guided Mode
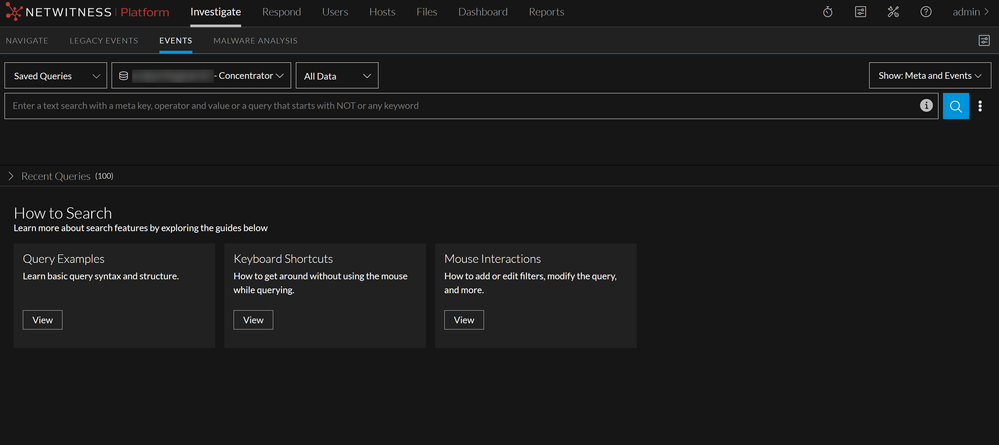
Guided Mode is the easiest way to create a query with features to help analysts enter valid queries. The following figure illustrates the initial Events view with Guided Mode in effect in the query bar.
This figure depicts the query bar in Version 12.3.1.
Keyboard Actions to Use in Guided Mode
In Guided Mode, the query builder allows entry, editing, and deletion of filters using the key strokes without having to use a pointer. Although you can use the pointer, you have the option to keep your fingers on the keyboard. This table identifies the available keyboard actions in Guided Mode when the cursor is located in the query bar; these do not apply to the service selector and time range.
| Action | Keyboard Entry |
|---|---|
|
Copy all filters (Version 11.4.1 and later) |
With the cursor in the query bar, but not in a filter being edited, and all filters selected, press Ctrl-C (Windows OS) or Cmd-C (MacOS). |
| Delete characters in a filter |
Selected characters: With characters selected in the query bar, press Delete or Backspace. Previous character (Version 11.4 and later): With the cursor next to a character in the query bar, press Backspace (Windows OS) or Delete (MacOS). All characters (Version 11.4 and later): With the cursor in a filter, press Delete (Windows OS) or Fn + Delete (MacOS). |
| Delete filters |
Selected filters: With one or more filters selected do one of the following:
Filter that has focus (Version 11.4 and later): With the cursor in a filter that has focus, press Backspace (Windows OS) or Delete (MacOS). The focused filter is deleted and focus moves to the left. Filter that has focus (Version 11.4 and later): With the cursor in a filter that has focus, press Delete (Windows OS) or Fn + Delete (MacOS). The focused filter is deleted and the focus moves to the right. |
|
Delete parentheses in a filter, do not delete the contents (Version 11.4 and later) |
With a set of parentheses, but not the contents selected, press Delete (Windows OS) or Fn + Delete (MacOS). The selected parentheses are deleted, but the contents of the parentheses remain. |
| Delete parentheses and their contents in a filter (11.4 and later) |
Selected parentheses: With a set of parentheses selected, do one of the following:
|
| Deselect all filters | With a filter selected, press Esc. |
|
Edit a selected filter |
With a single filter selected, press Enter. |
| Insert a new filter at the beginning of the query bar, and open for editing (Version 11.4 and later) | With a filter selected, press Home (Windows OS) or Fn + Left Arrow (MacOS). |
| Insert a new filter at the end of the query bar, and open for editing (Version 11.4 and later) | With a filter selected, press End (Windows OS) or Fn + Right Arrow (MacOS). |
| Insert a new filter to the immediate left of the selected filter, and open for editing | With a filter selected, press Shift + Left Arrow. |
| Insert a new filter to the immediate right of the selected filter, and open for editing. | With a filter selected, press Shift + Right Arrow. |
| Insert a new filter to the immediate left of the selected filter | With a filter selected, press the Left Arrow. |
| Insert a new filter to the immediate right of the selected filter | With a filter selected, press the Right Arrow. |
|
Open a new tab with the selected filters |
With filters selected, right-click > Query with selected filters in a new tab. |
| Query with the selected filters | With filters selected, right-click > Query with selected filters. |
| Query with content of parentheses (Version 11.4 and later) |
With parentheses selected:
|
|
Select all filters in the query bar (Version 11.4.1 and later) |
With the cursor in the query bar, but not in a filter being edited, press Ctrl-A (Windows OS) or Cmd-A (MacOS). |
|
Select all filters to the left of the current filter |
(Version 11.3.x and earlier) With a filter selected, press Shift + Up Arrow. (Version 11.4 and later) With a filter selected, press Shift + Right Arrow twice. |
| Select all filters to the right of the current filter |
(Version 11.3.x and earlier) With a filter selected, press Shift + Down Arrow. (Version 11.4 and later) With a filter selected, press Shift + Right Arrow twice. |
| Select the filter to the immediate left if one exists | With no filter selected, press the Left Arrow key. |
| Select the filter to the immediate right if one exists | With no filter selected, press the Right Arrow key. |
| Submit a query. | With focus on the query bar and no pending filters, press Enter. |
Visual Feedback in Guided ModeVisual Feedback in Guided Mode
Guided Mode provides visual feedback during query construction. This table identifies and describes the possible feedback.
| Feedback | Icon | Description |
|---|---|---|
|
Blue background on a Filter |
|
Indicates that a filter is selected. |
| Green circle between two filters | 
|
(Version 11.3 and earlier) A green circle indicates the location of the cursor between two existing filters. Clicking inserts a new filter at this location. (Version 11.4) A bold cursor indicates the insertion point. |
| Green filter outline |  |
Marks the single filter that has focus and ready to edit. This is combined with the blue background, when multiple filters are selected and this filter has focus. |
|
Red filter outline |
|
Indicates that the filter is invalid. A tool tip that explains the error is displayed. |
| Index indicators in the Meta tab |  |
(Version 11.4 and later) Indicate the index level of the meta keys in the Meta tab, which determines if you can use it in a filter:
The sessionID meta key is a special case. Unlike other non-indexed meta keys, it is not configurable, but you can use it in a filter so it is marked by the key symbol. Supported operators are exists, !exists, =, and !=. |
| Query Events button |  |
Used to submit a query, show the status of the query, and cancel a query. The button has three possible states: |
| Slow Service icon |  |
In the query console, marks the service that took the longest time to load results from the query. |
|
Spinner in the Events list |
|
Indicates that the query is currently being processed. The Query Events button is disabled while this occurs. |
| Stopwatch |  |
(Version 11.5 or earlier) Indicates that the meta key/operator combination requires extra time to process. While the query is still executable, a more efficient meta key or operator is recommended. |
Add a Simple Filter in Guided Mode
To create a simple filter in Guided Mode:
- Go to the Events view (Event Analysis view in Version 11.3 and earlier) and do one of the following:
- (Version 11.4.1 and later) Click in the query bar and when the filter entry form is displayed, select the Meta tab if it is not already selected.
- (Version 11.4 and later) Select Guided Mode, click in the query bar and when the filter entry form is displayed, select the Meta tab if it is not already selected.
- (Version 11.2 and later) Select Guided Mode and click in the query bar.
- (Version 11.1) Click in the empty query bar, or before or after an existing filter. This is an example of the empty query bar in Guided Mode before you begin entering a filter.
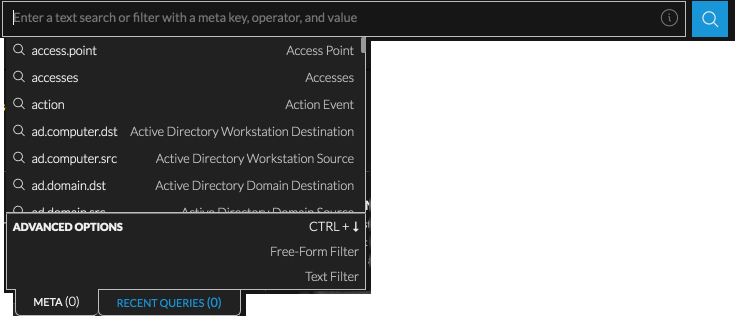
If the insertion point is between two filters, a green circle (Version 11.3 and earlier) or a bold cursor (Version 11.4 and later) marks the insertion point. If the insertion point is at the end of the query bar, the filter entry form opens with a blinking cursor at the entry point. A drop-down list displays the available meta keys passed from the service being investigated in alphabetical order. This figure shows the filter entry form from Version 11.4.
- To select a meta key do one of the following:
- If there is only one option in the drop-down list, press Enter.
- If there are two or more options in the drop-down list, click a meta key or select a meta key using the up/down arrows, then press Enter.
- Start typing the meta key. As you type the meta key, the list is filtered to include only meta keys that contain the text you typed. The count next to the label on the Meta (0) tab increments to enumerate the indexed meta keys that match the typed text. Keys that are not indexed are disabled and not selectable and are not included in the count, for example, alias.mac in the figure below is not indexed and is dimmed. Click a meta key or select a meta key using the up/down arrow, then press Enter.
- To select a highlighted meta key, press Enter.
The count on the Meta label changes to 1.Note: If no meta key in the drop-down list is selected, and the list has no meta keys to select, either the Free-Form Filter or the Text Filter option is highlighted based on the content already typed in the query bar.
--If the text typed in the query bar includes some form of query syntax and other operators not yet supported by the user interface, the Free-Form Filter option is highlighted and you can create a free-form filter. In Version 11.3 and earlier, the **, &&, ||, (), AND, OR, comma, -, length, and regex operators are not supported by the user interface. The Version 11.4 user interface supports these operators. If the Free-Form Filter is not highlighted, and the query bar has no text filter, the Text Filter is highlighted so you can create one.
--If the first condition is true, and there is already one text filter, the Free-Form Filter option is highlighted so you can create a free-form filter. - If you want to edit or delete the meta key, press Backspace or Delete.
As you backspace and delete characters, the meta key drop-down list is filtered to include meta keys that contain those characters. To select a meta key, press Enter.
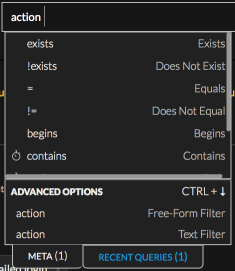
The meta key is added to the filter entry form, and a list of valid operators for the selected meta key is displayed. Operations that require more time to process are marked by a(stopwatch icon). This figure shows the stopwatch icon marking the contains operator.
- To select an operator, do one of the following:
- If there is only one option in the operators drop-down list, press Enter to select it.
- If there are two or more options in the operators drop-down list, click an operator or select one using the up/down arrows, then press Enter.
- Type the operator and press Enter. As you type, the operators drop-down list is filtered to show only operators that contain the typed text. Click an operator or select one using the up/down arrows, then press Enter.
The operator is added to the filter entry form. In Version 11.4 and later, if the operator accepts a value, the suggested values drop-down list is displayed. Earlier versions leave the cursor in the filter entry form so that you can type a value.
- (Optional) If the selected operator in the filter entry form accepts a value, do one of the following:
- In Version 11.3 and earlier, type the value and press Enter.
- In Version 11.4 and later, paste a value that you have copied from somewhere and press Enter.
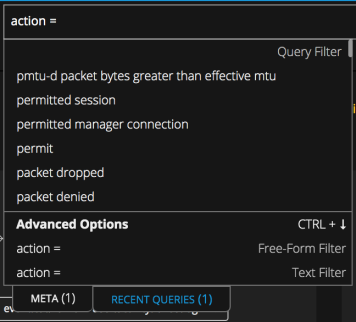
- In Version 11.4 and later, begin typing in the Query Filter field.
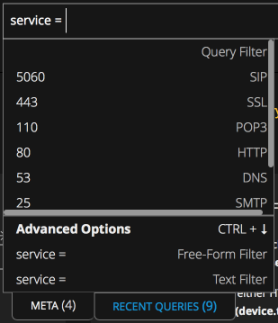
As you type, the meta value drop-down list is filtered to return up to 100 properly indexed values that begin with the typed text. The suggested values are based solely on the time range; filters in the query do not filter the list of 100. The auto-suggest function looks for matches in all events in the current data set, not just the (up to 10,000) downloaded events. If nothing in the list matches exactly, the text you typed in the Query Filter field is highlighted and this message tells you that no suggestions were found. Some values, such as the integers for the service meta key, also display the definition of the service type.
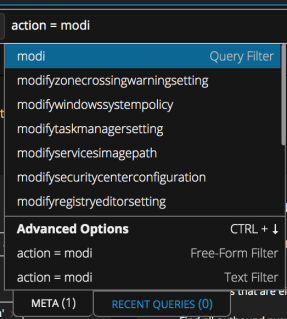
If there is an exact match, that value is highlighted. In the following example, there is no exact match for the typed text, modi.- If the typed text is the value you want to use in the filter, press Enter.
- If you see the value that you want to query in the list and it is not highlighted, click the value or use the up/down arrows to highlight the value. Then press Enter.
- If you want to edit or delete the value, press Backspace or Delete.
As you backspace and delete a character, the meta value drop-down list is filtered to include values that begin with the remaining characters. To select a value, press Enter.
The value is added to the filter entry form.
- To create the filter, press Enter. If you click anywhere outside the box before pressing Enter, the filter is not created.
The new filter is inserted, and the blinking cursor is refocused after the last filter, the meta keys drop-down list is displayed. If there is an error in the filter, it is outlined in red. You can hover over the filter to see a tool tip explaining the error. This figure shows a query being created with no errors. - If the filters have no errors, you are ready to execute the query in the query bar. Click
.
The results are returned and loaded in the Events panel. The first 10,000 events that match the query begin loading in the Events panel. As the events are loaded, a status bar at the top tracks progress and you can scroll to the bottom of the list to see the completion status. - (Optional in Version 11.3 and later) If you want to see detailed status in the Query Console, click the information icon
.
- (Optional in Version 11.3 and later) click the Query Console
> Current Query, If you want to see detailed status of a query.
- (Optional in Version 11.3 and later) If you want to cancel the query before it finishes executing, click
.
The query stops executing and a notification that the query has been canceled is displayed.
Add a Free-Form Filter in Guided Mode (Version 11.3 and Later)
To filter the data displayed in the Events view using a free-form filter in Guided Mode:
- Go to the Events view, select Guided Mode below the query bar, and click in the query builder field. (For Version 11.4.1, simply click in the query builder field.)
If the insertion point is between two filters, a green circle or a bold cursor marks the insertion point. If the insertion point is at the end of the query bar, the filter entry field opens with a blinking cursor at the entry point. A drop-down menu lists available meta keys passed from the service being investigated in alphabetical order. - Do one of the following:
- Place the cursor in the Free-Form Filter field and begin typing the query.
- Begin typing the filter beginning with a meta key or with an open parenthesis. When entering and editing filters in the query builder, parentheses pairs are automatically balanced. If you type an open parenthesis, the other part of the pair is added to the filter.
When no matching meta keys or operators are available in the drop-down menu, the Free-Form Filter option becomes available, and the text you typed is available in the Free-Form Filter field.
- Continue typing the entire expression and press Enter.
(If you click anywhere outside the box before pressing Enter, the filter is not created.) This figure shows a free-form expression created by continuing to type after the value GET.
The new filter is inserted, and the blinking cursor is refocused after the last filter, a new filter entry form is displayed. If there is an error in the filter, it is outlined in red. You can hover over the filter to see a tool tip explaining the error. - To execute the query, click
. While the query is executing, the
button changes to
.
- If you want to cancel the query before it finishes executing, click
.
If you do not cancel the query, you can clickto view the status of query execution. When the query is finished executing, the Events panel displays appropriate results for the query.
Add a Text Filter to Find a Value Anywhere in the Data Set
In Version 11.4 and later, the text filter allows you to find a specific value in the current data set (endpoint, logs, and network events). The text filter initiates a case-insensitive search against all the data for meta keys that are indexed by value. The text filter does not search for values that are indexed by meta key or not indexed so you not see all results. A message advises that Results may be limited by a text filter, which matches only indexed meta keys. If you want to conduct a more exhaustive search against raw events, click here and choose the appropriate options in the Search Events drop-down menu. Icons in the drop-down list indicate the index level of each meta key:
- indexed by meta key
- indexed by meta value
- not indexed
Note: All services in the hierarchy being queried (Broker, Concentrators, and Decoders) must be at Version 11.3 or later. The text filter is not available in the drop-down menu when there are services below Version 11.3 in the hierarchy.
The text filter is useful when you have some idea of what you are looking for, but are not sure where to look (which meta key or service). As an example, if you are interested in looking for a file name, click in the query bar, type the complete text string, and click Text Filter. The text filter initiates a search against all the data in the index, within the services and time range being investigated, and returns exact matches to the text string.
A query can include one text filter and any combination of simple and free-form filters. The operator for a text filter must be AND because it acts as a filter over the results of all the other filters in the entire query. If one text filter already exists in the query bar, the Text Filter option is disabled as shown in the figure below. Text filters are not supported inside parentheses.
To create a text filter:
- Go to the Events view and click in the query bar.
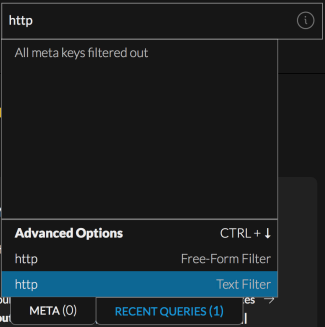
The query entry form is displayed. - Type the text string that you want to find, for example, http.
The text string is displayed in the meta key drop-down list under Advanced Options. - Click Text Filter under Advanced Options.
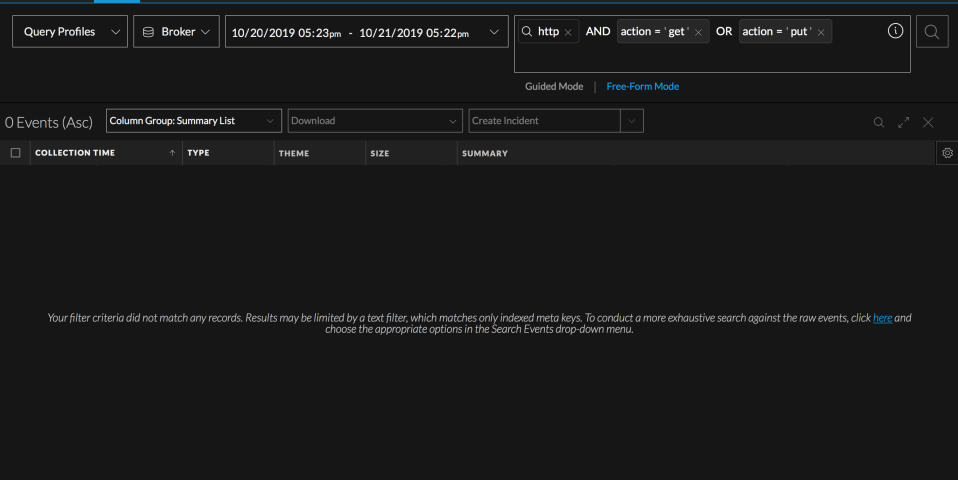
The text filter is created in the query bar. The following figure illustrates the different appearance of a text search filter versus a free-form filter. The free-form filter is in a fixed-space font and outlined in red. The red outline indicates a syntax error because a valid expression is expected in a free-form filter. The text filter is marked by the search icon. No syntax requirements are applied to text search filters. - (Optional) Create additional simple or free-form filters in the query bar. There can be only one text filter in the query. This example was created by typing http as a text filter and then adding two more filters - action = 'get' OR action = 'put'
- To submit the query, click
.
The results are displayed in the Events panel. This figure illustrates the Events panel with no results displayed and a message with instructions for improving results. Every time you use a text filter, this message is at the bottom of the results offering a link to expand your search. - Click the here link in the message.
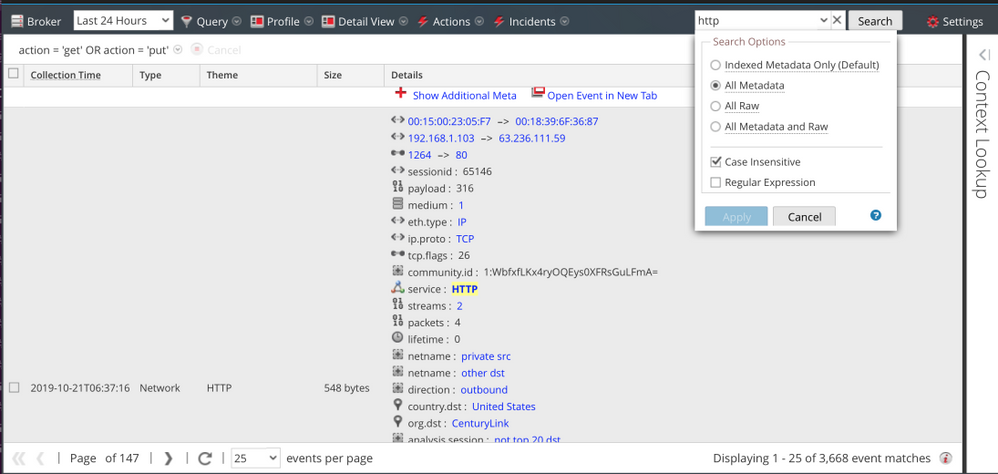
A new browser tab opens with the query results displayed in the Legacy Events view, where you have additional options to improve the search. This figure shows the results for the same query when non-indexed metadata is included. - Click the Information icon
in the query console to view the status of the query. This figure shows a text filter in the query console.
Select All Filters and Copy All Filters in the Query Bar (Version 11.4.1 and Later)
While creating a filter in the Events view query bar, you can use keyboard commands to select all filters (Ctrl-A for Windows OS, Cmd-A for MacOS) and then copy the selection to the local clipboard (Ctrl-C for Windows OS, Cmd-C for MacOS).
To select all filters and copy them to the clipboard:
- In the Events view > Events panel, click on a focused pill or in the query entry form, and press Ctrl-A for Windows OS or Cmd-A for MacOS.
All filters in the query bar are selected. - To copy the selected filters to the clipboard, type Ctrl-C for Windows OS or Cmd-C for MacOS.
You can share the clipboard with other analysts or paste the contents in the query bar.
Paste Text in the Query Bar
(Version 11.4 and Later) While creating a filter in the Events view query bar, you can paste instead of typing the complete text of a filter that you have copied from somewhere else. You can paste the text into an empty query bar or next to an existing filter in the query bar. Depending on the text you typed, the query parsing engine parses the information that you pasted and creates a new filter, which can be a simple filter, a free-form filter, or a text filter.
- A text string of this form is added as a new simple filter in the query bar: <valid meta key> <valid operator> <optional value>. This is an example: alias.host contains 's'.
- A text string of this form is added as two simple filters in the query bar: <valid meta key> <valid operator> <optional value> && <valid meta key> <valid operator> <optional value>. This is an example: alias.host contains 's' && action exists, which is converted to alias.host contains 's' AND action exists.
- A text string that contains unparsable text may be converted to a free-form filter. For example, using NOT (device.ip = 10.10.10.10) is unsupported for creation of a filter in Guided Mode, so this would be converted to a free-form filter. Free-form filters are validated by the server when they are submitted.
- Text that does not conform to the filter syntax is added as a free-form filter.
To create a filter by pasting text:
- Go to the Events view > Events panel, select Guided Mode under the query bar, and click in the query bar. (For Version 11.4.1, simply click in the query bar.)
The query entry form is displayed. - Type Ctrl-V (Windows OS), Cmd-V (MacOS), or right-click and Paste to paste text that you have copied into the clipboard from somewhere else. Do one of the following:
- If the text you pasted is a statement that can be parsed, one or more simple filters is created.
If the text you pasted is a statement that cannot be parsed, a new free-form filter is created.
If the text you pasted is not a statement and not a valid meta key, an invalid syntax error is displayed.
If you pasted a valid meta key for a new filter you are building, the meta key is highlighted in the drop-down list, and you can continue creating a filter as usual by entering an operator and a value.
After you select a valid meta key and a valid operator (for example, city.dst =) any text that you paste is treated as a text string if the meta key supports a text value, and one filter is created. If the meta key does not support a text value all of the text in the query bar is parsed as described in step a above.
- If the text you pasted is a statement that can be parsed, one or more simple filters is created.
- Add more filters in the query bar if you wish, and then submit the query.
The query is executed.
Insert a Filter Based on a Recent Query
(Version 11.4 and Later) In the Guided Mode query bar, you can insert a filter based on a recent query. When the Recent Queries tab is opened and nothing has been typed in the query bar, up to 100 of your most recently executed queries are displayed in a scrollable list. The list is sorted to show the most recent at the top, and the Recent Query count is set to 0. When you begin typing, the list is filtered to display up to 100 queries from the query history database that contain matching text, even if the matches are not in the most recent 100 queries. The Recent Query count changes to reflect the number of matching queries as you type.
The top entry in the list is highlighted by default. To select a recent query, you can move the highlighting up and down in the list using the up and down arrow or by mouse-over of a recent query. As you type the list is filtered and the highlighting moves back to the top of the list. Clicking a query, or pressing Enter while a query is highlighted, creates a new filter with the text of the selected query.
Whenever you submit a query, the list is sorted to add that query, now the most recent, at the top.
To create a filter based on a recent query
- Go to the Events view, select Guided Mode under the query bar, and click in the query bar. (For Version 11.4.1, simply click in the query bar.)
The Meta Key drop-down list is displayed in the Meta tab. - Select the Recent Queries tab.
The Recent Queries drop-down list is displayed with a count of 0. - To search for a recent query, do one of the following:
- Begin typing some text.
As you type more characters or backspace to delete characters, the list is filtered to show recent queries that contain the text you typed. The count in the Recent Queries label increments to show the number of matching queries as you type. - To select a query and add a new filter, continue to type and use the up and down arrows until the query you want to use as a new filter is highlighted.
- With a query highlighted, press Enter or simply click a query that you see in the list.
The filter is added in the query bar.
- Begin typing some text.
- Add more filters in the query bar if you wish, and then submit the query.
The query is executed and the list is sorted to add that query, now the most recent, at the top.
Edit a Filter in Guided Mode
With a query in the Guided Mode query bar, you can edit a filter. To edit a filter:
- Double-click the filter, or click the filter and press Enter.
- Edit the filter. When finished editing, press Enter to update the filter.
- If you want to execute the query again, click
.
The Events panel displays results for the updated filter.
Query Using Selected Filters in Guided Mode
When you have one or more filters in the query bar in Guided Mode, you can refocus the query to include only selected filters, displaying results in the current browser tab or a new browser tab. Some filters include expressions with nested parentheses in Version 11.4, and you can refocus part of a filter that includes nested parentheses. To update the query using only selected filters, do one of the following:
- Using a query that includes one or more simple filters, for example a query has three filters: risk.info exists, direction ='lateral', and threat.category exists.
- Select direction = 'lateral', right-click the filter and select Query with selected filters in a new tab in the drop-down menu.
A new tab opens with the results for the selected filter and the original query is left intact on the previous tab. - To query the selected filters in the same tab, select direction = "lateral" and threat.category exists. Then right-click and select Query with selected filters in the drop-down menu.
A query with only the selected filters is submitted and all remaining filters are removed.
- Select direction = 'lateral', right-click the filter and select Query with selected filters in a new tab in the drop-down menu.
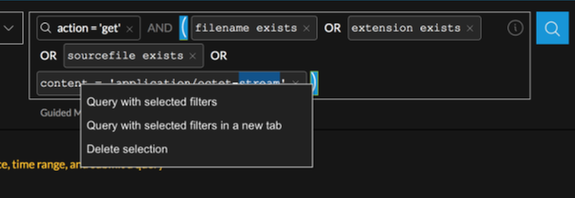
- (Version 11.4) For a query that includes a filter containing nested parentheses, for example: action = 'get' AND (filename exists OR sourcefile exists OR content = 'application/octet-stream'), do one of the following:
- Select the close parenthesis after 'application/octet-stream', right-click, and select Query with selected filters in a new tab.
A new tab opens with results for (filename exists OR sourcefile exists OR content = 'application/octet-stream'). - Select the same, right-click, and select Query with selected filters.
The results for (filename exists OR sourcefile exists OR content = 'application/octet-stream') are displayed in the current tab.
- Select the close parenthesis after 'application/octet-stream', right-click, and select Query with selected filters in a new tab.
Delete a Filter and Delete Text or Parentheses in a Filter in Guided Mode
Some keystroke editing features became available in Version 11.4; these are labeled in the steps.
- To delete a filter, do any of the following:
- Click X in a filter.
- Select the filter and press Delete (Windows OS) or Fn + Delete (MacOS).
- (Version 11.4 and later) Select the filter and press Backspace (Windows OS) or Delete (MacOS).
- Right-click one or more filters and select Delete selected filters or Delete selection (Version 11.4 and later) in the drop-down menu.
The filter and the operator to the right or left of the filter is deleted, ensuring that no extraneous operators remain in the query bar.
- (Version 11.4 and later) To delete characters in a filter or parentheses and contents in a filter, do any of the following:
- To delete the previous character: With the cursor next to a character in the query bar, press Backspace (Windows OS) or Delete (MacOS).
- To delete all characters: With the cursor in a filter, press Delete (Windows OS) or Fn + Delete (MacOS).
- To delete the selected characters: With characters selected in the query bar, press Delete or Backspace.
- To delete parentheses, but not the characters inside the parentheses, select one of the parentheses and press Delete (Windows OS) or Fn + Delete (MacOS).
- To delete a set of parentheses and the contents, for example, (filename exists OR sourcefile exists OR content = 'application/octet-stream'), select the parenthesis after get, right-click, and select Delete selection.
Everything except action = 'get' is deleted.
Create a Query in Advanced Mode
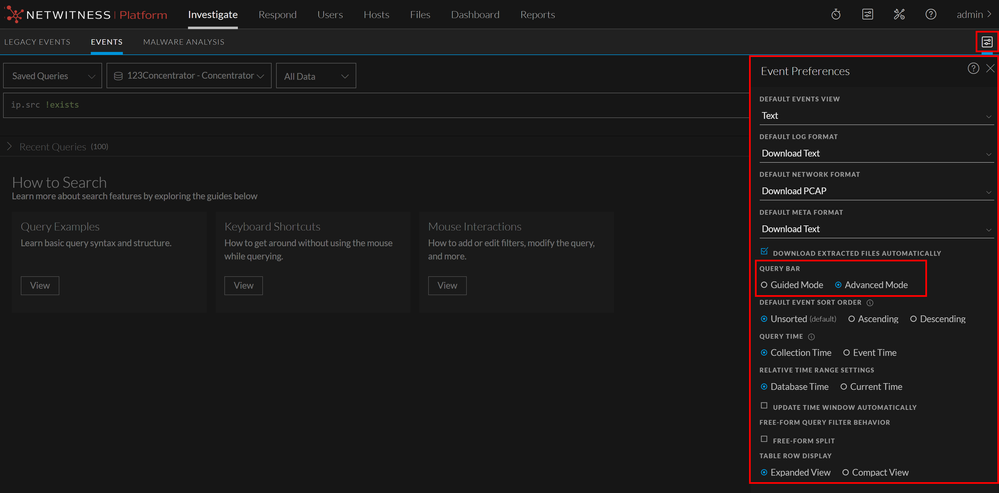
In addition to the Guided Mode query bar, NetWitness introduces the new Advanced Mode query bar in Version 12.3 to provide a seamless experience to the users while they write queries. Advanced Mode query bar provides a search bar with the ability to accept a query construction in text form just like an Integrated Development Environment (IDE), instead of the pill-based entry of Guided Mode.
Advanced users can now quickly construct a new query or modify the existing queries and get the list of matching events. While constructing queries, users can continue typing queries without pressing enter. Advanced Mode query bar also has other great features:
-
Syntax or error highlighting: The syntax of each query is validated and a red outline marks invalid filters.
-
Auto suggestions: Suggestions like a meta key, an alias for medium, an operator in a drop-down list to help in query construction.
-
Recent queries: Displays recent queries.
To enable the advanced query bar:
-
Go to Investigate and click
(Event Preferences).
The Event Preferences dialog is displayed.
-
Select Advanced Mode in the Event Preferences dialog.
As you write or edit a query, the query bar provides suggestions. Press Tab Key or click on the highlighted suggestion to select a suggestion.
Note: Advanced Query Bar may not correct as many errors as Guided Query Bar while typing a query.
Create a Query in the Free-Form Mode
Free-Form Mode is used in Version 11.2, 11.3, and 11.4, but no longer available in Version 11.4.1.
Free-form queries are most useful when you have a long text string saved that you want to paste, or if you have one in mind that you want to enter quickly, and you know the meta keys, valid operators, and valid syntax for entering values. The following figure illustrates the initial Events view with the empty Free-Form query builder field. The first example is Version 11.2 and the second example is Version 11.3.
The blinking cursor indicates that you can enter a query. You can enter free text here. As more expressions are added and they cannot be displayed in a single line, they wrap to another line and the input area expands vertically so that all filters are visible without scrolling to the right.
These are some examples of queries that you can enter in Free-Form mode:
To find events with an 8- to 11- character username similar to atreeman-72:
user.all length 8-11 && (user.all regex '^a[a-z]{2}ee[a-z]{3}-[0-9]{2}')
To find events that are either HTTP network events or related to aix or ciscoasa logs:
service=80 || (device.type = 'aix','ciscoasa')
To find all outbound events not going to Canada or the United States:
direction = 'outbound' AND not(country.dst = 'united states' || country.dst = 'canada')
If you have a submitted query in Guided Mode, the query is transformed into text when you click switch to Free-Form mode. This is an example of a query submitted in Guided Mode as two filters, service = 80 and direction = 'outbound', and then viewed in Free-Form mode.
The 

Operations that require more processing time are not highlighted as they are in Guided Mode, but this table provides a summary of expensive operations for reference.
| Index Method | Non-Text Value | Text Value | Regular Operations | Expensive Operations |
|---|---|---|---|---|
| By Key |  |
exists, !exists | eq, !eq | |
| By Key |  |
exists, !exists | eq, !eq, begins, ends, contains | |
| By Value |  |
exists, !exists, eq, !eq | no expensive operators | |
| By Value |  |
exists, !exists, eq, !eq, begins |
ends, contains |
|
| By None | special case for sessionid | exist, !exits, eq, !eq |
no expensive operators |


