Create Springboard Panel Dialog
In the Create Springboard Panel dialog, you can create a Springboard panel from selected query in the Events view. You can add any number of filters in the query search bar and convert them into Springboard panels. The Springboard panels are then available to analysts for detection and monitor the results.
To access this dialog, while investigating a service in the Investigate > Events view, add a query on the query search bar > 
IMPORTANT: Ensure that you first create a custom private board in Springboard.
What do you want to do?
| User Role | I want to ... | Show me how |
|---|---|---|
|
Incident Responder or Threat Hunter |
review detections and signals seen in my environment |
NetWitness Platform Getting Started Guide |
| Threat Hunter | query a service, metadata, and time range* |
Related Topics
Quick Look - Create Springboard Dialog
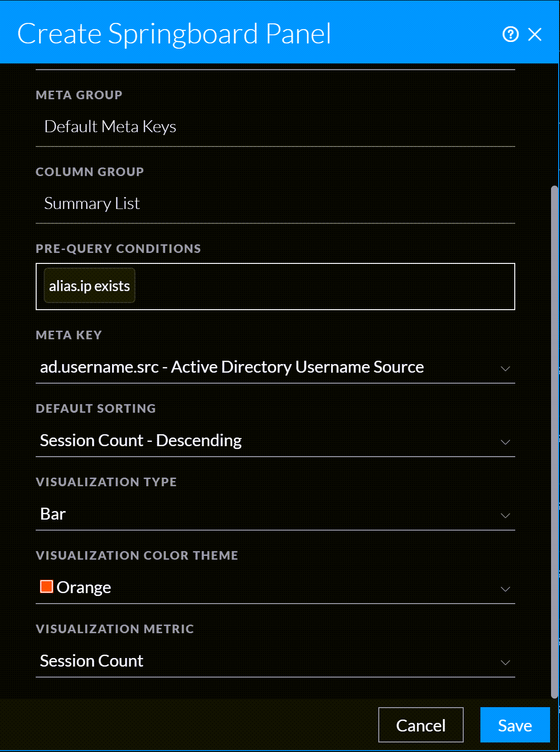
This is an example of the Create Springboard dialog.
The following table describes the fields in the Create Springboard Dialog view.
| Feature | Description |
|---|---|
| Name | (Required) Specifies a name to identify the panel. In the example, the name is Sample Incident. You can provide a name that clearly identifies the nature of events that will be added to this incident |
| Meta Group | Displays the currently selected meta group from the filter query already selected. |
| Column Group | Displays the currently selected column group from the filter query already selected. |
| Location | Displays the location where the defined query is saved. |
| Pre-Query Conditions | Defines a limiting filter for results in the Events view. If you had a query active in the query bar when you began to create the new Springboard panel, the active query is added to the pre-Query field. This is an example of a pre-query condition: 'service=80,25,110'. |
|
Meta Key |
Displays a drop-down listing meta keys available for the service. |
|
Default Sorting |
Displays a drop-down listing sorting options. |
|
Visualization Type |
Displays a drop-down listing different color theme options:
|
| Visualization Color Theme
|
Displays a drop-down listing Visualization type options:
Note: The Multiple color option is available only for the Donut chart. |
| Visualization Metric | Displays a drop-down listing available Visualization metric options. |
|
Cancel |
Closes the dialog without applying changes. |
| Save | Saves the changes. |


