Perform Post Upgrade Tasks
This topic lists the tasks you must perform after upgrading NetWitness Platform. Complete the tasks that apply to the hosts in your environment.
General
You must configure Jetty, restore the core services contents, and also start Network capture, Log capture, and aggregation after upgrading NetWitness Platform.
Configure Jetty
For Jetty Configuration and related information, see Manage Custom Host Entries topic in the System Maintenance Guide.
Make Sure Services Have Restarted and Are Capturing and Aggregating Data
Make sure that services have restarted and are capturing data (this depends on whether or not you have auto-start enabled).
If required, restart data capture and aggregation for the following services:
- Decoder
- Log Decoder
- Broker
- Concentrator
- Archiver
- In the NetWitness Platform menu, go to
(Admin) > Services.
The Services view is displayed. - Select each Decoder service.
-
Under
(actions), select View > System.
-
In the toolbar, click
To Start Log Capture:
-
- In the NetWitness Platform menu, go to
(Admin) > Services.
The Services view is displayed. - Select each Log Decoder service.
- Under
(actions), select View > System.
- In the toolbar, click
- In the NetWitness Platform menu, go to
To Start Aggregation:
-
In the NetWitness Platform menu, go to
(Admin) > Services.
The Services view is displayed.
-
For each Concentrator, Broker, and Archiver service:
- Select the service.
- Under
(actions), select View > Config.
-
In the toolbar, click
-
For Event Stream Analysis (ESA):
Note: Mixed mode is not supported for ESA hosts in NetWitness Platform version 11.6 and later. The NetWitness server, ESA primary host, and ESA secondary host must all be on the same NetWitness Platform version.
There are no required post-upgrade tasks for ESA. For ESA troubleshooting, see ESA Troubleshooting Information.
If you want to add support for Endpoint, UEBA, and Live content rules, you must update the multi-valued and single-valued parameter meta keys on the ESA Correlation service to include all the required meta keys. It is not necessary to make these adjustments during the upgrade; you can make the adjustments later at a convenient time. For detailed information and instructions, see Update Your ESA Rules for the Required Multi-Value and Single-Value Meta Keys in the ESA Configuration Guide.
Restore the Core Services Contents
Once you upgrade to 12.4, the Core services Contents such as Configuration files (.cfg), Feeds, Parsers, and Log Devices are copied to the .tar location of the respective components such as Decoder, Log Hybrid, Network Hybrid, and Log Decoder.
The following table lists the Core Services Contents paths and the .tar location of the respective components where the Core Services Contents are copied.
Core Services Contents Paths Components .tar location of the Components /etc/netwitness/ng/feeds (Feeds) Decoder /var/netwitness/decoder/decoder_backupcontent_ccm.tar /etc/netwitness/ng/parsers (Parsers) Log Hybrid /var/netwitness/logdecoder/logdecoder_backupcontent_ccm.tar /etc/netwitness/ng/envision/etc/devices (Log Devices) Network Hybrid /var/netwitness/decoder/decoder_backupcontent_ccm.tar /etc/netwitness/ng/NwDecoder.cfg (Configuration files (.cfg)) Log Decoder /var/netwitness/logdecoder/logdecoder_backupcontent_ccm.tar By default, CCM option is disabled. After upgrading to 12.4, if you enable CCM and encounter the loss of the Core Services Contents, you can use the backup tar files to recover the lost data. For more information, see https://community.netwitness.com/t5/netwitness-knowledge-base/automatic-backup-of-core-service-content-after-upgrading-core/ta-p/694527.
Event Stream Analysis (ESA)
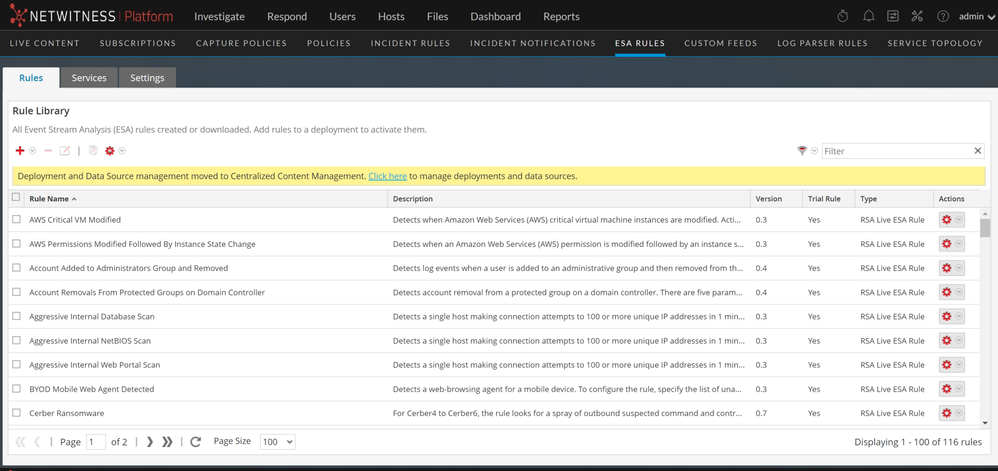
After upgrading to the 12.4 version, all the ESA deployments will be migrated to 
Note: Analysts must have appropriate permissions to view the ESA rules under 

The pre-upgrade and post-upgrade states of deployments are represented in the following table.
| SlNo | Pre-upgrade Deployment State | Post-upgrade Deployment State | ||
|---|---|---|---|---|
| Creates Policy | Creates Group | The policy will be Published | ||
| 1 | Healthy deployment |
Yes |
Yes |
Yes |
| 2 | Deployment with errors | Yes | Yes | Yes |
| 3 | Deployment with only rules |
Yes |
No |
No |
| 4 | Deployment with no rules | No | No | No |
(Optional) Using the Merge Policy button, you can merge a policy having ESA content with a policy with no ESA content. For more information, see Merge Policy with ESA Content topic in the Live Services Management Guide.
Manage ESA Deployments and Data Sources
You can only manage the ESA deployments and Data Sources through Centralized Content Management. Go to 
You must upgrade the ESA hosts immediately after upgrading the Admin Server.
For more information on Centralized Content Management and managing the deployments, see Centralized Content Management Guide for NetWitness.
Respond
The Primary ESA server must be upgraded to 12.4 before you can complete the following task.
Note: After upgrading the primary NW Server (including the Respond Server service), the Respond Server service is not automatically re-enabled until after the Primary ESA host is also upgraded to 12.4. The Respond post-upgrade tasks only apply after the Respond Server service is upgraded and is in the enabled state.
(Conditional) Restore Any Respond Service Custom Keys in the custom_normalize_alerts.js and support new datasource
Note: If you did not manually customize the custom_normalize_alerts.js, you can skip this task. We attempt to automatically migrate the custom keys. However in case of failures, use this step to verify the custom data's integrity.
If you added custom keys in the /var/netwitness/respond-server/scripts/custom_normalize_alerts.js file for use in custom normailization, modify the /var/netwitness/respond-server/scripts/custom_normalize_alerts.js file and add the custom normalized keys from the automatic backup file. The backup file is located in /var/netwitness/respond-server/scripts and it is in the following format:
custom_normalize_alerts.js.bak-<time of the backup>
In case of automatic update of the script fails, add support for Netwitness Core and NetWitness Insight by updating the custom_normalize_alerts.js file manually to support these new sources in respond.
User and Entity Behavior Analytics
Complete the following tasks after upgrading UEBA to 12.4.
-
Update the UEBA configuration using the following command from the UEBA machine.
- source /etc/sysconfig/airflow
-
source $AIRFLOW_VENV/bin/activate
-
python /var/netwitness/presidio/airflow/venv39/lib/python3.9/site-packages/presidio_workflows-1.0-py3.9.egg/presidio/resources/rerun_ueba_server_config.py
-
deactivate
-
(Optional) Update the UEBA processing schema, if needed.
NetWitness recommends that the UEBA start date is set to 28 days earlier than the current date. For UEBA systems that intend to process TLS data, you must make sure that the start date is set to no later than 14 days earlier than the current date.
For more information, see the "reset-presidio script" section in the UEBA Configuration Guide.
-
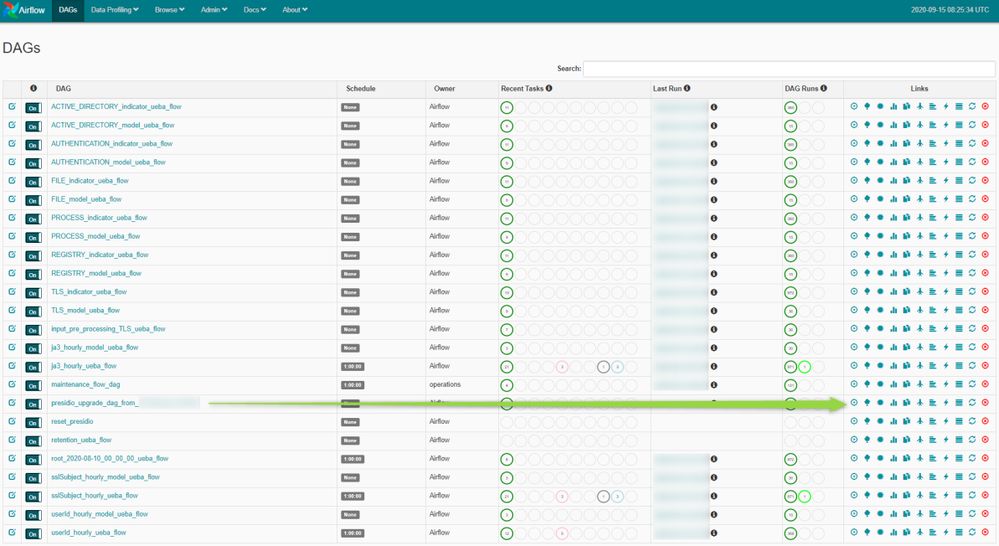
Run the airflow upgrade DAG.
-
Go to Airflow main page https://<UEBA-host-name>/admin
- Enter the admin username and password.
-
Click the Play in presidio_upgrade_dag_from_<previous_version> to_12.4.
Note: A light green circle will appear next to the upgrade DAG row during the upgrade. If the upgrade process is completed successfully the light green circle changes to green. If the upgrade process fails, the light green circle changes to red.
-
-
Set the appropriate "Boot Jar Pools" slots:
-
Physical Appliance: Update the spring_boot_jar_pool slot value be 18.
- Virtual Appliance: Update the spring_boot_jar_pool slot value to 22.
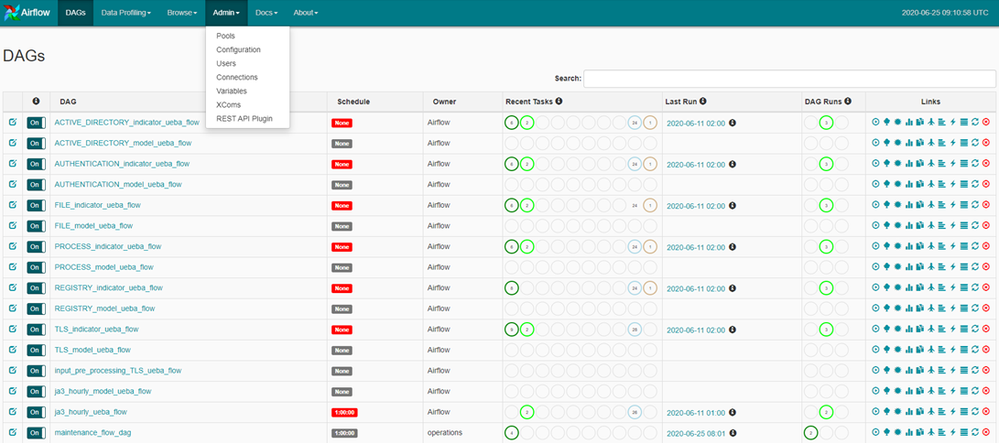
To update the Spring Boot Jar Pools slots, go to the Airflow main page, tap the Admin tab at the top bar and tap Pools.
- To access the Airflow UI, go to https://<UEBA_host>/admin and enter the credentials.
User: admin
Password: The environment deploy admin password.
- Click on the pencil mark of the Pools to update the slot values.
-
-
Edit the spring_boot_jar_pool and update the slots amount to 22.
Warehouse Connector
The Warehouse connector uses a lockbox to store credentials securely for data integration sources and destinations. However, users upgrading from earlier versions to the 12.4 version cannot start the configured streams without migrating their existing credentials in the new lockbox. As a result, users must manually create a new lockbox key and then refresh the password for their sources and destinations configured in Warehouse Connector, wherever applicable, using the following steps :
-
Log in to the NetWitness Platform.
-
Navigate to
(Admin) > Services.
-
In the Services view, select the added Warehouse Connector service, and select
> View > Config.
-
In the Services Config view of Warehouse Connector, click the Lockbox Settings tab and create a fresh lockbox key.
-
Reauthorize the user account in source configurations using Explore or REST API. Reauthorization of source user account is not available in UI. The command to reauthorize the user account from Explore is given below:
> /warehouseconnector/sources/<source:port> ---> setPass property with password=<password of the configured user in source>
-
Reauthorize the user account in SFTP destination configuration from UI, Explore or REST API. The command to reauthorize the password from Explore is given below:
> /warehouseconnector/destinations/<sftp_destination> ---> setPass property with password=<password of the configured user in SFTP destination>
-
If NFS directory mount was removed as part of pre-upgrade step, mount back the same configuration. Additionally, enable back the mount entry in /etc/fstab.
> mount -t nfs -o nolock,tcp,hard,intr <IP_Address_for_SAW>:/mapr/<cluster-name> /<directory_name>
Where <IP_Address_for_SAW> is the IP address of the primary Warehouse appliance in the cluster and <cluster-name> is the name provided in the template file.
Legacy Windows Log Collector
Refresh Legacy Windows Log Collector Certificates with Updated SA Certificates
Post Upgrade Steps:
-
Execute the following command in SA:
-
wlc-cli-client --host-display-name hostDisplayName --service-display-name serviceDisplayName --host WLChostIPAddress --port 50101 --use-ssl false
Enter following information:
-
Legacy Windows Log Collector REST Username and Legacy Windows Log Collector REST Password: Enter the admin credentials for the Legacy Windows Log Collector.
-
Security Server Username and Security Server Password: Enter admin credentials for NetWitness.
-
-
-
Restart the system.
Perform Sanity Checks After Upgrade
You must perform the following sanity checks after upgrading to NetWitness 12.4.
-
Go to
(Admin) > Services view to verify that all the services are active (appearing in green) after upgrade.
-
Verify that the services are upgraded to match the host version. The service version in
(Admin) > Services view must match the host version in
(Admin) > Hosts view after upgrade.
-
In the
(Admin) > Services view, do the following.
-
Select a Log Collector service and go to
(actions) > View > System view to verify if the required logs collection is started. You should click the
drop-down option and go to the right collection protocol to check if the logs collection is started. If the required collection is not started, select
next to the required collection protocol from the list to start the collection.
-
Select a Log Decoder service and go to
(actions) > View > System view to verify if the Log Decoder is capturing the logs properly.
-
Select a Packet Decoder service and go to
(actions) > View > Config view to check if the capture interface is configured under Decoder Configuration section. If the capture interface is not configured, you must select the required capture interface from the drop-down list to configure it. If the capture interface is already configured, go to the
(actions) > View > System view of the Packet Decoder and check if the capture is started. If the capture is not started, click
to start the packet capture.
-
-
Go to
(Admin) > Services > Select a Log Decoder or Packet Decoder service >
(actions) > View > Stats > General view to analyze the current capture rate.
-
Verify that the Concentrators, Archivers, and Brokers are aggregating the data. Make sure that you can investigate from each Concentrator, Archiver, and Broker to validate that it is operational.
-
Go to Respond > Alerts view to verify if the alerts are triggering from different sources.
-
Go to
(Admin) > Health & Wellness > Alarms view and verify if the SMS server is up and running.
-
Go to
(Admin) > Event Sources > Monitoring Policies view and verify if the policies configured before upgrade are appearing.
-
Go to
(Admin) > Health & Wellness > New Health & Wellness > Pivot to Dashboard > Elastic > Dashboard view and ensure the following.
-
The visualizations you created before upgrade still exist.
-
The metric server is up and running.
-
Alerts are generated properly for the monitors you have configured before upgrade.
-


